How to Setup & Manage a Portfolio (Pt. 5/5)
In this part we will calculate the correlation of assets in our portfolio and conclude the series. This is the last part of this series, you can read the first 4 here:
- [1] https://steemit.com/money/@profitgenerator/how-to-setup-and-manage-a-portfolio-pt-1-5
- [2] https://steemit.com/money/@profitgenerator/how-to-setup-and-manage-a-portfolio-pt-2-5
- [3] https://steemit.com/money/@profitgenerator/how-to-setup-and-manage-a-portfolio-pt-3-5
- [4] https://steemit.com/mathematics/@profitgenerator/how-to-setup-and-manage-a-portfolio-pt-4-5
You have to understand that the correlation between the assets in your portfolio has to be as low as possible. This is because if 2 assets are highly correlated, that is like keeping only 1 asset with double risk.
So if you allocate 3% of your portfolio to ASSET A, and another 3% to ASSET B, then if they are 90% correlated that is essentially a risk of 5.4% with only a mere 0.6% free floating variable.
Because our first rule is to protect our capital, and for this the technique called Hedging is often used. The strategy is based on a basket of assets that are uncorrelated, but all do give some % returns yearly.
So you make money by % returns on each of them, but sometimes some of them might have a bad year, and if they are uncorrelated with the others, the net risk will be 0, as when 1 asset goes up, the other will go down, and in net effect it will have a small drawdown on your total equity.
For example:
- If BTC goes up 20% this year and if the stock market goes down 15% this year, then you don't take a hit at all, and you are still up 5%. Whereas if you only had stocks, you would have lost a pretty significant %, hopefully only exposed a small % of your capital to.
So on 1 hand you limit the individual asset the risk to about 1-3% of your capital, and on the other hand you limit the collective asset risk of the entire portfolio by hedging all assets and having uncorrelated assets in the basket.
So for this we need to calculate the correlation of the assets in your portfolio, and for this we need a spreadsheet manager again.
Calculating the Correlation
- We will use XMR and STEEM for our example, daily close prices, grabbed from Poloniex
https://poloniex.com/public?command=returnChartData¤cyPair=BTC_XMR&start=1&end=99999999999&period=86400
https://poloniex.com/public?command=returnChartData¤cyPair=BTC_STEEM&start=1&end=99999999999&period=86400
- We convert this to
.CSVvia https://konklone.io/json, then open up our spreadsheet manager LibreOffice or Excel. - We delete all columns other than the
dateandcloseand format the date from the unix timestamp to visible date format. (For some reason my office can't convert the unix epoch correctly so I leave the integer values)
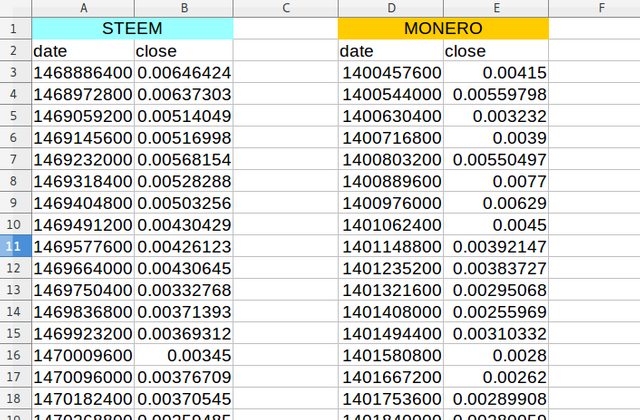
- Then we align the dates, and since the STEEM historic is smaller, we use that as base. So press
CTRL+Fand search for1468886400, find that in the Monero column, and delete every row above that. Now the 2 lists should be equal length.
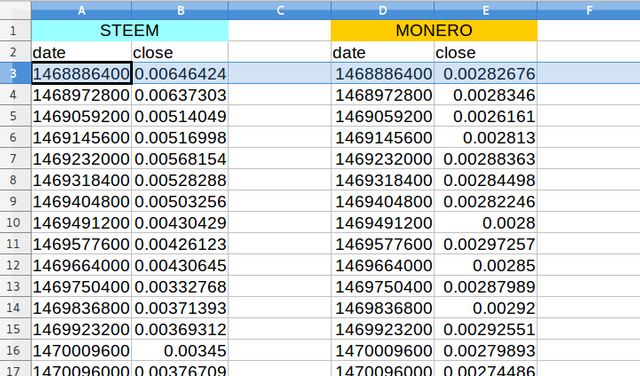
- Now in a cell next to it, we compute the correlation factor by typing
=CORREL(B3:B999999,E3:E999999), and make sure the 2 list have always the same length. We want to correlate only the price.
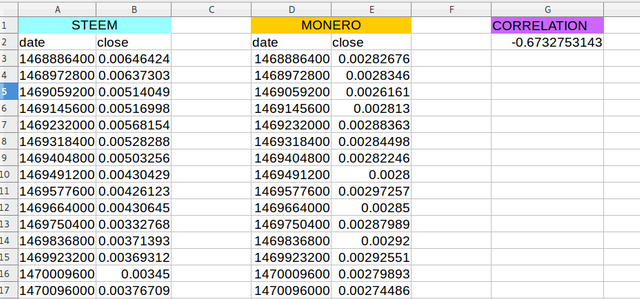
The correlation value is: -0.6732753143, which is roughly -67% in percentages. Now there is correlation, as the absolute value is 67%, which means that the Monero and Steem market is correlated by 67%.
However they are negatively correlated, which means that when 1 market goes up, the other goes down. Technically if the Steem market goes up there is a 67% percent chance that Monero will go down, and so on.
Correlation is not causation, it's not that Steem influences Monero or vice versa, but this is how it is.
So these 2 coins would make a good contrast in one's portfolio, because you can use them for hedging. Yet you should still aim for low correlation, and adding more assets would help to this.
You will need to correlate all assets in your portfolio with each other to see how much are they correlated, and there are many more advanced tools that could help you.
So let's recap

- A portfolio is an organized way to manage your assets by using mathematics and keeping statistics of all your financial activities.
- In a portfolio we always work with gross values, they give us statistical precision. Your tax calculations should be separate from your portfolio calculations, in a portfolio we measure our market performance, and not our budget.
- We us a spreadsheet software to keep track of all activities. We have a summary of our assets & liabilities on the front sheet, and transaction history and statistics in other separate sheets.
- We should prefer liquid assets over non-liquid ones, because they are more flexible at investing, but usually liquid assets have less returns, so we need to balance this out.
- Our assets should be somewhat predictable, and not wildly random, and we should have trusted assets only, and not scams.
- First rule: Protect your Capital! Then try to make money with it.
- Don't risk more than 3% of your total capital on 1 single investment or asset.
- Beware of volatility, it can be both beneficial, and risky. Use your sense how volatile your want your investments to be.
- There are many more risks other than market risk. Biggest risks in cryptocurrencies are hacks, thefts and scams.
- Assets should be uncorrelated between one another, or negatively correlated, to perform Hedging strategies
- You should hedge your portfolio in a way that your drawdown should not exceed the 3% maximum we can tolerate.
That's it for this series. I hope you have enjoyed it and learned something from it. Thanks for reading!
Disclaimer: The information provided on this page might be incorrect. I am not responsible if you lose money from the information you've read on this page! This is not an investment advice, just my opinion and analysis for educational purposes.
and the best portfolio.. is diversified! :D
nice post~
Yes indeed it is.