How to Setup & Manage a Portfolio (Pt. 4/5)

In this part we will explore more practical and analytical aspects of a portfolio. It will contain a little bit of quantitative analysis, which is a huge discipline branch of quantitative finance. It's a huge science, you can go to a university if you want to explore it deeply, but here I will only tell you the necessary basics that you must know in order to calculate volatility, risk, and such. You can read the previous parts here:
- [1] https://steemit.com/money/@profitgenerator/how-to-setup-and-manage-a-portfolio-pt-1-5
- [2] https://steemit.com/money/@profitgenerator/how-to-setup-and-manage-a-portfolio-pt-2-5
- [3] https://steemit.com/money/@profitgenerator/how-to-setup-and-manage-a-portfolio-pt-3-5
There is no way to skip math, it is essential if we want to quantify risk. Risk, or at least market risk is always quantified as volatility, the amount the price swings in either direction. Of course if the market goes in a favorable direction, that doesn't matter, because remember the first rule:
Protect your capital first!
So if we are in a wild market that swings like crazy, then you are just as likely to score big, than to lose big, and a wise investor will always try to minimize risks first. We are not cowboys, we usually want our risk exposure of our total capital to be small. The 2-3% rule we've talked about earlier.
So an advanced investor sets the % portion allocated to an asset, based on the risk it poses, and for that we must quantify the risk. We always use the market volatility as the first risk factor (there are other risks too, like 3rd party risks, and so on, but that you will also consider when allocating your portfolio).
The Standard Deviation (σ)
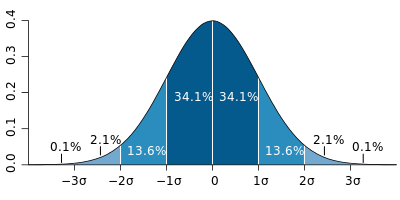
(Source: Mwtoews)
The volatility of a market, is called Variance in mathematics, and the variance is an informal distance of the price swings from the mean price.
The formal measurement unit is called a Standard Deviation (σ) which represents the % of the price going outside a boundary, and it's derived from the variance.
Most markets are distributed in a Normal Distribution, if the timeframe we look at is high enough. Some markets at some timeframes rather form a Poisson Distribution, especially if the market is less volatile and measured at small time-frames. But as a general rule of thumb, if we look at Daily Close Prices, the market pretty much resembles normal distribution. I don't want to complicate this, as you are probably not that familiar with these concepts, so let's keep it simple.
I only look at daily CLOSE prices, if there is a huge price spike in the LOW or HIGH price, that means that the market has liquidity problems, and we should avoid that market entirely, as described in the previous parts of the series. So the CLOSE price pretty much reflects a good sample price of the market, so we will do an exercise.
So here is our beautiful formula (don't worry it's not that scary):
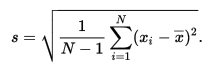
(Source: Wikipedia.org)
And let's open our LibreOffice Calc and calculate the Bitcoin's volatility:
- First we grab Bitcoin's historical data from Blockchain.info, in USD $:
https://blockchain.info/charts/market-price - Then we click
All Timeand export it in.CSVformat to work with easily in spreadsheet - Then right click, open with
LibreOffice Calc, and import is as it shows with default spacing - Now you will see 2 columns, A is the date and B is the price, and there is no price data until the 2010-08-17, so just delete the rows before that, so we start off with 0.0769 $ as first Bitcoin price.
- Now just calculate the standard deviation with 1 simple formula, so just use the next column, and write there:
=STDEV(B1:B999999)and it will give you the standard dev. It will be different than mine, since you probably download this guide later with new prices added at the bottom as each day passed by, so don't worry about that.
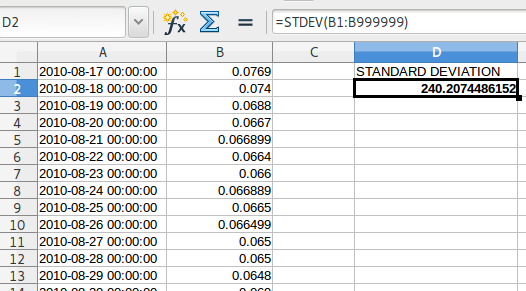
- Ok so the current standard deviation (for you it might be other number) is 240.20$
- We also need to calculate the average (mean) for explained why later, with the following formula:
=AVERAGE(B1:B999999)
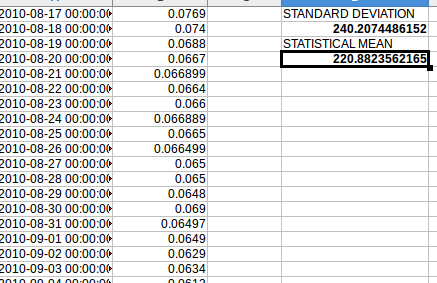
That would be 220.88$, again for you it might be different!
So what does this mean? How to use this information?
Well statistics is beautiful, and this is how it works:
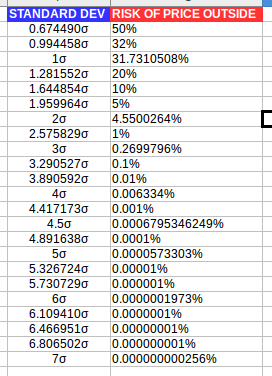
- 1 STANDARD DEVIATION (σ) in a normal distribution (which in a daily timeframe we assume it is) is equal to 31.7310508% probability that the price will go outside this range, from the mean.
- 2 STANDARD DEVIATION (σ) in a normal distribution (which in a daily timeframe we assume it is) is equal to 4.5500264% probability that the price will go outside this range, from the mean.
.....and so on
Here is a table to calculate the risk of the price going outside:
Now of course this only works if we invested at the mean price, which is rarely the case, so we will have to measure custom distance values in the probability distribution.
So we can just use the Chebyshev's Theorem or the Z score to measure it:
Putting it all Together (VERY EASY)
Ok, so we know Bitcoin has an average price of 220.88$ and a standard deviation of 240.20$, so now I want to invest in Bitcoin, and I want to calculate the price swing risk.
Let's say I bought BTC at 300$, what is the risk of the price going down? Well first I set my stoploss to 250$, so if the price hits this, we will automatically sell. Since our stoploss will work well, and we don't risk more than that, we only care about the price distance between the buy price and the stoploss. So what is the probability of the price going this low?
So we need to calculate the area between the stoploss and our buy price, on the distribution curve. We will use Z-score and Normal Distribution Formula . The Chebyshev's Inequality only works for higher than 1 σ, but we need more flexibility.
First we translate the 250$ to standard deviation, with the Z-score formula:
Z-score = (NUMBER - MEAN / STANDARD DEVIATION)
Z-score = (250$ - 220.8823562165 / 240.2074486152)
Z-score = 0.121218738 σ
Then we translate our current price to a standard deviation:
Z-score = (300$ - 220.8823562165 / 240.2074486152)
Z-score = 0.3293721499 σ
Now we use Normal Distribution Formulain LibreOffice:
=NORMSDIST(Z-SCORE) for both scores
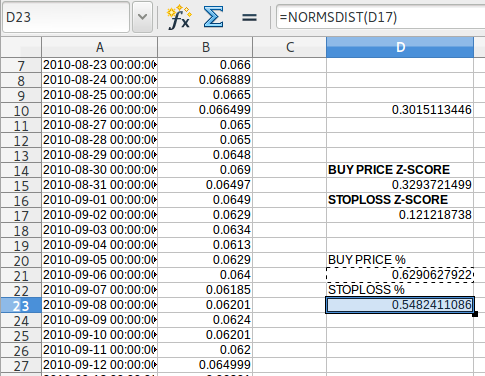
Where the BUY PRICE = 0.62 and the STOPLOSS = 0.54, all measured from the left, so the area from the left side of the curve until the selected points have a probability of that.
The last thing to know the distance, is to subtract from the rightest/higher value (BUY PRICE), the stoploss point to get the probability of the distance between. Therefore:
AREA PROBABILITY = 0.6290627922-0.5482411086 = 0.0808216836
PERCENTAGE = 0.0808216836 *100 =8.08216836%
This means that the probability of the Bitcoin price to go between 250$ and 300$ is 8.08%. And since this is our stoploss area, this is our risk of losing money.
And now you can calculate any area you are interested, profit area, loss area, you name it. This is how you calculate the area under a probability curve.
Now of course there will be other risks too, that you have to consider, but basically this is how you can calculate your volatility risk in any market, by analyzing the historical data, applying some math to it, and it's done.
After you know the probability of losing money, you will know how to adjust your investment size to limit the exposure risk (as previously said, about 1-3% of your total capital / investment).
That's it for this analysis, of course if you want to be very precise you would estimate the distribution, or use timeseries or other quant tools, that are more precise than this. But this is just a basic information that I think every investor should know.
If you want to dive deep in the quantitative finance world, start here: https://arxiv.org/archive/q-fin
Disclaimer: The information provided in this article might be incorrect. I am not responsible if you lose money from the information you've read on this page! This is not an investment advice, just my opinion and analysis.
Thanks for reading through, it was a big effort to put this article out, please donate 1 Steem Dollar to promotion by clicking the Promote button, and help me get this very useful information out to every investor! I think every investor has to read this, because I bet 95% of investors have no idea how to calculate risk.
Thanks for reading through, this is my longest articles since and I've worked on it 4+ hours. In my opinion every investor has to read this, to understand how to calculate the price swing risk. It is not that hard, you just need a spreadsheet program and some time.
Also I think this article will hit big, so if any whale would spend a few SBD on promotion of this article, he could gain that back (and more) via curation (although there is risk involved). I think this article could be worth many hundreds of SBD, so the curators could profit.
I would be very thankful if people would help make this article viral, this is very important info, thank you :)