How to Setup & Manage a Portfolio (Pt. 2/5)

In this part I will teach you step-by-step how to setup your portfolio spreadsheet, and do some basic calculations on it, plot a few charts, and analyze the data. This is a continuation of the series you can read the previous part here:
https://steemit.com/money/@profitgenerator/how-to-setup-and-manage-a-portfolio-pt-1-5
I am using LibreOffice on Linux, which is a free spreadsheet software, on my work machine, so I recommend you to setup this for your work setup, but I assume it would be similar to Microsoft Excel, as a lot of function names are similar, the layout, and the buttons, etc.
So let's start:
- Install it, and start Calc, the spreadsheet software (LibreOffice is a software bundle, with many more softwares grouped together under the LibreOffice brand, Calc is the spreadsheet manager)
- Save it somewhere safe, named like
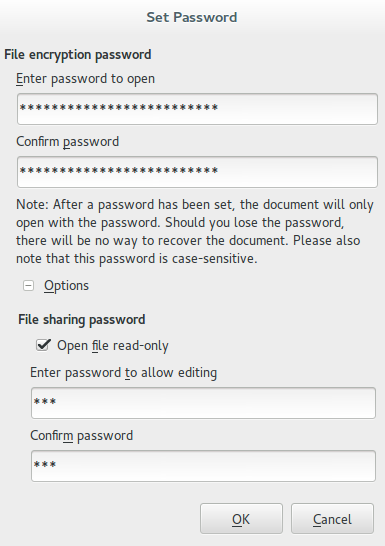
MY_SPREADSHEET.ods, or whatever, with a strong password:
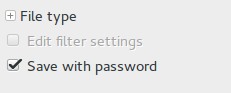
- In the next window type in your password (at least 20 characters) and click on
Optionsto click onOpen file read-onlyand set a read only password too. Now the read only password can be as simple as 123, the reason which is that we can accidentally change the values in the spreadsheet, so only edit when necessary. A simple read-only password like123can ensure this. Of course, the file is still encrypted, so no unauthorized person will be able access it.
- Now we have our spreadsheet file, make sure you keep multiple backups of it, as ransomware malware could pose a threat to it. To my knowledge the encryption of the file is very good, but still don't upload it to cloud-hosting services, just as a precaution. We should value our privacy.
- Now you can add your numbers into the cells, in an elegant layout, format it as you wish, but the numbers should be in a top-down order, so the columns will contain 1 set of information and the first row will generally be the title. Most formulas prioritize columns over rows, so that is the default layout. In this series I will use a fictional portfolio, obviously, named Bob's Portfolio, and this is how it will look like:
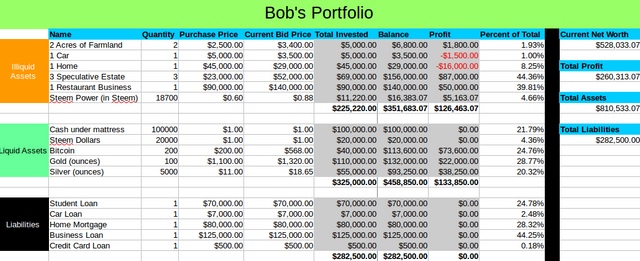
This is a pretty simple one, of course it can be more complicated, but usually we split it in 3 groups: LIQUID ASSETS (assets that can be sold quickly), ILLIQUID ASSETS (assets that are hard to sell), LIABILITIES (debt).
- I usually like to give a gray background color to cells containing formulas:
- Total Invested = Quantity * Purchase Price (for example, the farmland:
C5*D5, the cell coordinates) - Balance = Quantity * Bid Price (for example, the farmland:
E5*D5, the cell coordinates) - Profit = Balance - Total Invested (for example, the farmland:
G5*F5, the cell coordinates) - Net Worth = L Assets + Ill Assets + Liab. (for example, the farmland:
G11+G18-G25, the cell coordinates)
.... and so on, the rest of it just add up the numbers
- Total Invested = Quantity * Purchase Price (for example, the farmland:
You just click on a cell, write = and enter the cell coordinates to add them up, that is how it calculates it. A spreadsheet is basically a giant calculator chalk board. For basics just read their documentation if in doubt.
NOTE: For current price we always use the current bid price, because we only care about the current sell price of the asset. If we were to liquidate now, how much we can liquidate it for. Usually the spread is small between ask and bid price, but for illiquid markets, that might not be the case.
Keep in mind that this is a very basic portfolio sheet, usually this would be your summary sheet, containing only references from other sheets. While all other sheets would contain the data, the trades, the statement informations.
We will also need to know not just the current bid price, but all the historical prices to calculate volatility, risk, correlation, or even get into advanced quantitative analysis. More about this in the future.
Now let's create a simple pie chart of the Percent of Total column, by just selecting all that section, and click on Insert Menu > Object > Chart > Pie Chart:
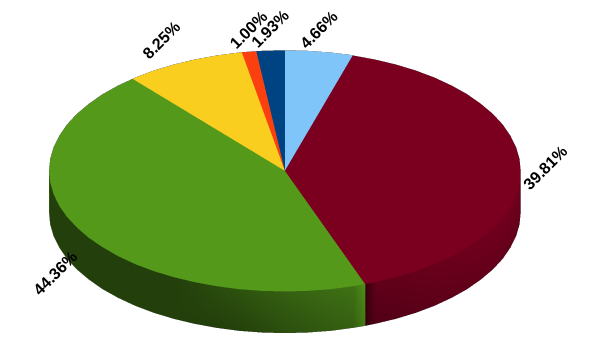
It would look something like this after a little formatting, making the labels visible, and showing them outside of the pie. This would also make your portfolio more visual, by adding charts, or even decorative pictures to it.
This is all for this basic introduction how to create a simple portfolio spreadsheet, in the next chapter we will talk about more theoretical things, about risk, volatility, correlation, and so on. Then in the 4th part, we will touch again more practical things with spreadsheets, and creating more advanced spreadsheets displaying more quantitative things.
Stay tuned for next part, it will be very interesting!
@profitgenerator how have we not stumbled upon one another's posts? Just saw your comments in kaylinarts post (who I follow regularly). I post real estate investing education as well as financial items (stock talk, charting).
Day traded for 5 years, worked as an advisor as well. This stuff is right in my wheelhouse. Look forward to seeing more from you. Upvoted and following now. Love the user name..
Thanks, I plan to reflect my username in my articles.