Mathematics Statistics: Finding the interquartile range of a set of ungrouped, unordered data - Part 5

In a data set, the difference between the upper and lower quartiles is called the interquartile range.

For example:
Find the interquartile range:
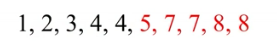
2, 4, 5, 4, 8, 7, 8, 7, 3, 1
You start by arranging the data set in order from least to greatest:
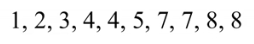
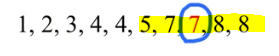
Now, in order to find the lower quartile and the upper quartile, we need to cut the data in half, like this:
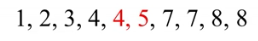
The half is between the red 4 and the red 5.
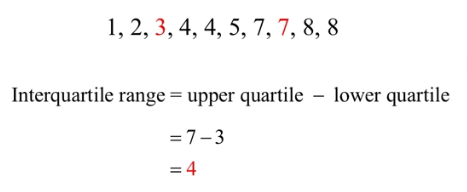
We need to find the lower quartile which is the mean of the first half set of data:
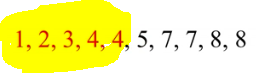
We have 5 numbers in the first half. The middle number is 3 so the lower quartile in this case is 3
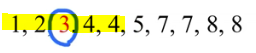
Now we need to find the upper quartile, and as you can see, we have 5 numbers in the second half:
The middle number is 7 so the upper quartile in this case is 7.
Now we have:
Now try:
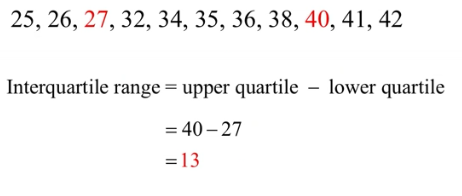
Find the interquartile range:
26, 36, 34, 25, 40, 41, 27, 32, 35, 38, 42.
Solution:
In Part 6, I will explain how to find the mean of a set of numbers from a table.
Part 1: https://steemit.com/mathematics/@ghostgtr/mathematics-statistics-application-on-cumulative-frequency-part-1
Part 2: https://steemit.com/mathematics/@ghostgtr/mathematics-statistics-application-on-mean-part-2
Part 3: https://steemit.com/mathematics/@ghostgtr/mathematics-statistics-construct-the-relative-frequency-table-of-a-set-of-numbers-part-3
Part 4: https://steemit.com/mathematics/@ghostgtr/mathematics-statistics-how-to-draw-a-histogram-part-4

Team South Africa banner designed by @bearone
nice informative post
Good set of post my friend, short, precise and and concise, I have a suggestion if You think to publish another post like this, in the try for the readers, let the exercise open, I mean, let people to do the exercise and put their answer in the comments in order to do Your post interactive.