[Matplotlib] 06. Plot Accessories: Legend
06. Legend
도표의 정보를 정확히 전달하기 위하여 레전드의 사용은 필수적이죠. 레전드를 표시하는 명령어는
matplotlib.pyplot.legend(*args, **kwargs)입니다.
위 웹사이트에 나와 있듯이, 레전드를 이용하는 가장 간단한 방법은 다음과 같습니다.
line = ax.plot([1, 2, 3], label='label1')
ax.legend()
즉, 그림 그리는 함수에서 "label"을 지정하면, 나중에 "label" 내용이 자동으로 레전드로 나타나는 식입니다.
흔하지는 않지만 만약 수동으로 레전드를 설정해야 할 경우에는 다음과 같이 할당할 수 있습니다.
ax.legend((line1, line2, line3), ('label1', 'label2', 'label3'))
06.1. Legend Option 1: 'loc'
레전드 함수에는 정말 다양한 옵션들이 있는데요,
가장 많이 쓰이는 옵션은 당연히 위치를 지정해주는 'loc' 옵션이겠죠.
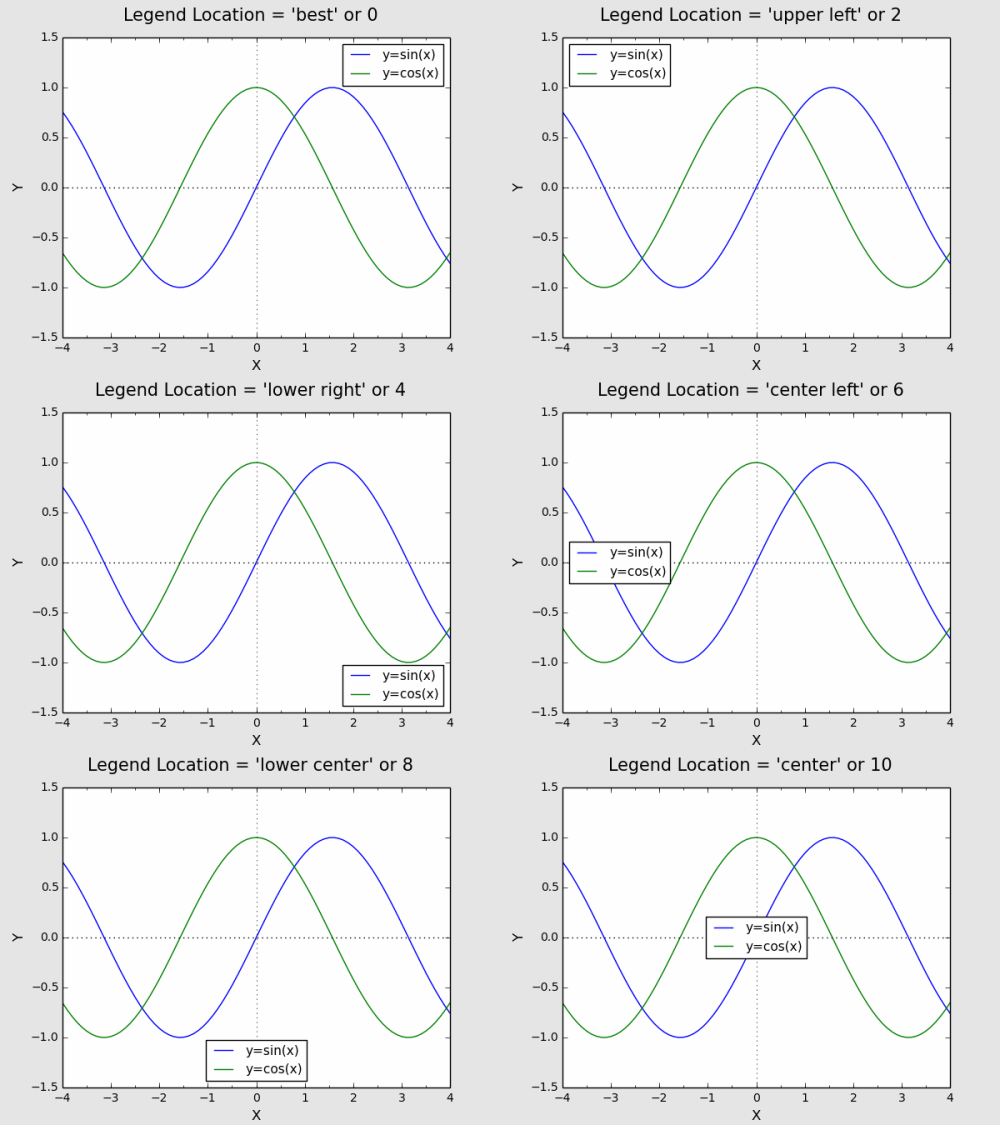
아래의 코드는 11가지의 모든 'loc' 옵션으로 그림을 그릴 수 있도록
"For Loop"를 사용하여 반복하였습니다.
import sys
import numpy as np
import matplotlib.pyplot as plt
from matplotlib.ticker import AutoMinorLocator, MultipleLocator

legend_loc_idx=[
    ['best'     ,0], ['upper right'     ,1], ['upper left'  ,2],
    ['lower left'   ,3], ['lower right'     ,4], ['right'   ,5],
    ['center left'  ,6], ['center right'    ,7], ['lower center'    ,8],
    ['upper center' ,9], ['center'  ,10],
    ]

###--- Synthesizing data to be plotted ---###
x = np.arange(-4,4.1,0.1)
ysin = np.sin(x)
ycos = np.cos(x)

for (loctxt,locnum) in legend_loc_idx:
###--- Plotting Start ---###
##-- Page Setup --##
    fig = plt.figure()            # Define "figure" instance
    fig.set_size_inches(6,4.5)    # Physical page size in inches, (lx,ly)
    suptit="Legend Location = '{}' or {}".format(loctxt,locnum)
    fig.suptitle(suptit,fontsize=15)   # Title for the page

##-- Plotting for axis1 --##
    ax1 = fig.add_subplot(1,1,1)   # subplot(# of rows, # of columns, indicater)
    line1=ax1.plot(x,ysin,label='y=sin(x)')     # plotting line graph1
    line2=ax1.plot(x,ycos,label='y=cos(x)')     # plotting line graph2

    ax1.set_xlim(-4,4)
    ax1.xaxis.set_major_locator(MultipleLocator(1))   # For Major Ticks
    ax1.xaxis.set_minor_locator(MultipleLocator(0.5))   # For minor Ticks
    ax1.set_xlabel('X',fontsize=12)

    ax1.set_ylim(-1.5,1.5)
    ax1.set_ylabel('Y',fontsize=12)

    ax1.tick_params(axis='both',which='major',labelsize=10)
    ax1.axhline(y=0.,color='k',linestyle=':')
    ax1.axvline(x=0.,color='k',ls=':',lw=0.5)

    ax1.legend(loc=locnum,fontsize=11)
##-- Seeing or Saving Pic --##
#plt.show()   #- If want to see on screen -#
    outdir = "./"
    outfnm = outdir+"06_plot_accessary.legend.{}.png".format(locnum)     # File format is decided by the file name, eg. png here
#fig.savefig(outfnm,dpi=100,facecolor='0.9',bbox_inches='tight')   # dpi: pixels per inch
    fig.savefig(outfnm,dpi=100,facecolor='0.9')   # dpi: pixels per inch
    plt.clf()    # Clear figure

sys.exit()
.
위 코드를 실행하여 각각의 'loc' 옵션이 어떻게 레전드를 생성했는지 아래 그림을 봐주세요.
06.2. Legend Option 2: 'bbox_to_anchor'
위에서 보셨듯이 "ax.legend()"는 다양한 위치 옵션을 제공하지만, 이것만으로는 부족할 때가 있습니다. 레전드를 정확히 원하는 위치에 그리고 싶을 때 이용하는 옵션이 'bbox_to_anchor' 입니다. 이 옵션은 기준이 되는 점 하나를 설정하고, 이 점을 기준으로 'loc' 옵션을 조합하여 정확히 원하는 지점에 레전드를 표시할 수 있게 합니다.
위 프로그램에서 레전드 함수를 다음과 같이 바꾸어,
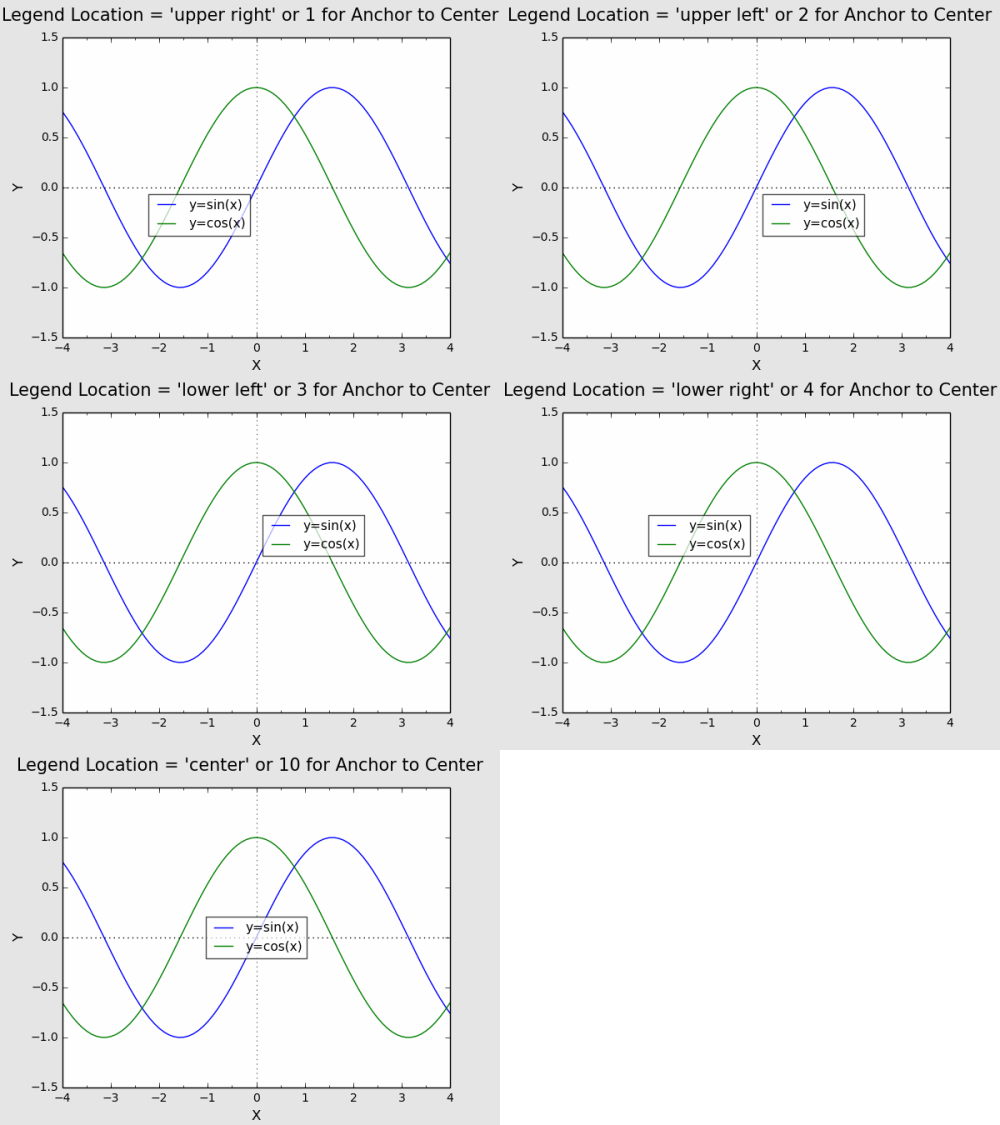
그림의 중심을 기준으로 레전드 위치를 바꾸어 보았습니다.
ax1.legend(loc=locnum,bbox_to_anchor=(0.5,0.5),fontsize=11,framealpha=0.7)
('framealpha' 옵션을 사용하여 반투명하게 바꾸었습니다.)
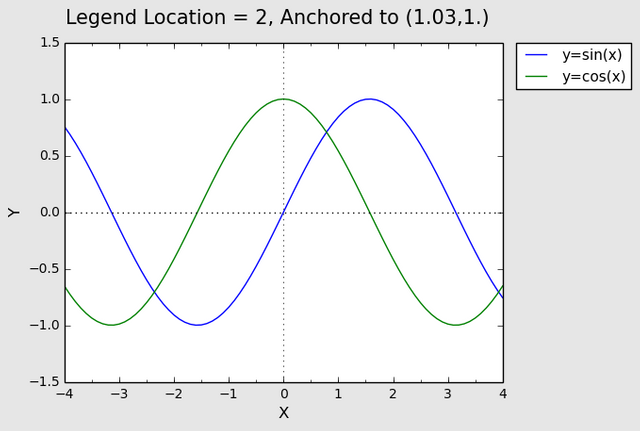
제가 개인적으로 애용하는 레전드의 위치는 도표의 오른쪽 밖입니다.
ax1.legend(loc=2,bbox_to_anchor=(1.03,1.),borderaxespad=0.,fontsize=11)
('borderaxespad' 옵션의 효과는 위와 아래 그림을 자세히 비교하시면 아실 수 있을거에요.)
이 외에도 정말 다양한 레전드 옵션이 존재합니다. 레전드 박스안의 색을 바꾼다거나, 예쁘게 꾸밀 수도 있고, 레전드 항목이 많을 경우 2단 또는 3단으로 배열할 수도 있고, 스캐터플롯과 같이 마커의 모양이 중요할 경우 마커를 몇 개 표시하는 지 까지 바꿀 수 있습니다. 이런 여러가지 가능성은 Legend에서 확인하시기 바랍니다.
이상 레전드에 대해 알아보았습니다.
"""
제 개인적 목표는
- Object-Oriented Programming과 친해지기
- Github와 친해지기 입니다.
이 목표에 닿기 위해 일단 제가 나름 좀 아는 Python, 그 중에서도 Numpy와 Matplotlib로부터 시작하려 합니다.
"""
List
[Matplotlib] 00. Intro + 01. Page Setup
[Matplotlib] 02. Axes Setup: Subplots
[Matplotlib] 03. Axes Setup: Text, Label, and Annotation
[Matplotlib] 04. Axes Setup: Ticks and Tick Labels
[Matplotlib] 05. Plot Accessories: Grid and Supporting Lines
[Matplotlib] 06. Plot Accessories: Legend


upmewhale: 1 SBD
99.91%에 글 포스팅, 7분만에 보팅.
전체 대기 물량은 21.18 SBD.
스팀가격 $2.48, 스파 258,720, 100% 보팅시 $42.92일 때,
보팅 4.72% 받아서 $2.14 받음.
promobot: 1 SBD
99.89%에 글 포스팅, 10분만에 보팅.
전체 대기 물량은 31.8 SBD.
스팀가격 $2.48, 스파 362380, 100% 보팅시 $60.1일 때,
보팅 3.14% 받아서 $2.10 받음.
총평:
보팅봇의 경우 2.5배는 받아야 확실한 이득임에 비추어봤을 때, 둘 다 만족스런 결과는 아님. 하지만 현재 스팀의 가격이 많이 떨어진 상태인데, 만약 1주일 후 조금이라도 오른다면 보팅 금액은 상향될 가능성도 있음. 둘 다 30분 안에 보팅 받았으므로 나쁘지 않을 결과.
You got a 4.72% upvote from @upmewhale courtesy of @dj-on-steem! Earn 90% daily earning payout by delegating SP to @upmewhale.