[Matplotlib] 03. Axes Setup: Text, Label, and Annotation
"""
제 개인적 목표는
- Object-Oriented Programming과 친해지기
- Github와 친해지기 입니다.
이 목표에 닿기 위해 일단 제가 나름 좀 아는 Python, 그 중에서도 Numpy와 Matplotlib로부터 시작하려 합니다.
"""

03. Axes Setup: Text, Label, and Annotation
그림의 x축 혹은 y축의 Label이름표와 임의의 장소에 Text표시, 그리고 Annotation에 대하여 다뤄보겠습니다.
03.1. Axes Label
x축과 y축의 Label이름표를 다는 명령어는
Axes.set_xlabel(xlabel, fontdict=None, labelpad=None, **kwargs)
Axes.set_ylabel(ylabel, fontdict=None, labelpad=None, **kwargs)
가 있습니다.
사용법은 간단하며, 일단 예제 코드를 보시겠습니다.
import sys
import numpy as np
import matplotlib.pyplot as plt

###--- Synthesizing data to be plotted ---###
x = np.arange(5)     # Same as x = np.array(range(5))
y = x**2             # Basically item-wise calculation for numpy arrays

###--- Plotting Start ---###
##-- Page Setup --##
fig = plt.figure()            # Define "figure" instance
fig.set_size_inches(6,4.5)    # Physical page size in inches, (lx,ly)
suptit="Label, Text, and Annotation"
fig.suptitle(suptit,fontsize=15)   # Title for the page
fig.subplots_adjust(left=0.12,right=0.95,bottom=0.15,top=0.91)

##-- Plotting for axis1 --##
ax1 = fig.add_subplot(1,1,1)   # subplot(# of rows, # of columns, indicater)
ax1.plot(x,y)                                      # plotting line graph

##-- Label, Text, and Annotation --##
ax1.set_xlabel('Left\nTop',ha='left',va='top',x=0.,fontsize=12)
ax1.set_ylabel('Left\nTop',ha='left',va='top',y=0.,fontsize=12)
#ax1.set_xlabel('Center\nCenter',ha='center',va='center',x=0.5,fontsize=12)
#ax1.set_ylabel('Center\nCenter',ha='center',va='center',y=0.5,fontsize=12)
#ax1.set_xlabel('Right\nBottom',ha='right',va='bottom',x=1.,fontsize=12)
#ax1.set_ylabel('Right\nBottom',ha='right',va='bottom',y=1.,fontsize=12)

ax1.text(0.5,15.,'Normal Text')
pos1=ax1.get_position().bounds  ##<= (left,bottom,width,height)
plt.figtext(pos1[0]+pos1[2]*0.05,pos1[1]+pos1[3]*0.85,'Text in Pink Box',backgroundcolor='pink',color='k',fontsize=12)

ax1.annotate(r'$y=x^2$', xy=(3., 9.),  xycoords='data',
             xytext=(3.5,4.), textcoords='data', size=12,
             arrowprops=dict(arrowstyle="->", connectionstyle="arc3,rad=0.5"),
             )

##-- Seeing or Saving Pic --##
#plt.show()   #- If want to see on screen -#
outdir = "./"
outfnm = outdir+"03_axes_setup.textlabel1a.png"     # File format is decided by the file name, eg. png here
#fig.savefig(outfnm,dpi=100,facecolor='0.9',bbox_inches='tight')   # dpi: pixels per inch
fig.savefig(outfnm,dpi=100,facecolor='0.9')   # dpi: pixels per inch

sys.exit()
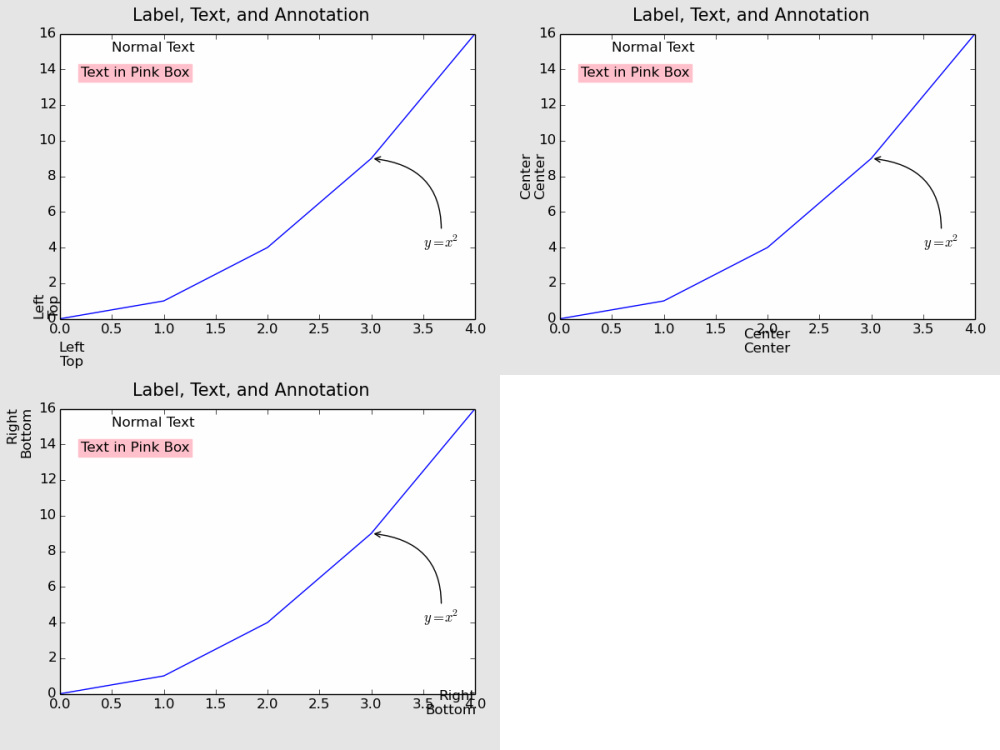
위 코드에서 Label의 정렬 방법을 각각 세 가지로 설정하였을 때 아래 그림과 같이 정렬이 됩니다.

x축에서는 "Center & Top"이, y축에서는 "Center & Bottom"이 적당해보이는군요. 여기서 "Top"과 "Bottom"은 각각 기준점에 글자의 상단 그리고 하단이 위치한다는 의미입니다.
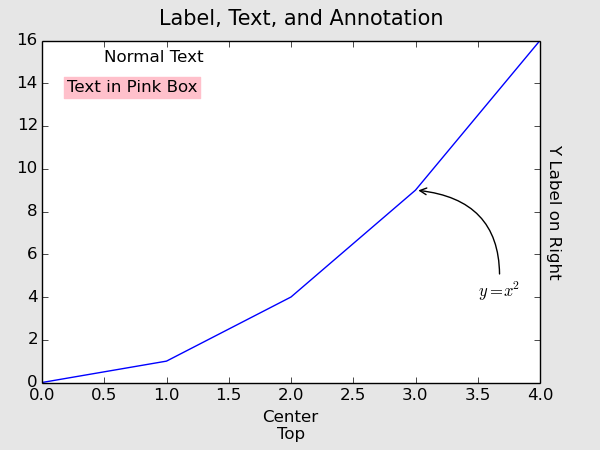
만약 y축 이름표를 오른쪽에 붙이고 싶으면 어떻게 할까요?
위 예제 코드의 "ax1.set_ylabel(..." 부분을 다음과 같이 고치면 됩니다.
ax1.set_ylabel('Y Label on Right',fontsize=12,rotation=-90,labelpad=15)
ax1.yaxis.set_label_position('right')
더하여, 사실 그림 좌우 여백도 좀 손을 봤습니다. (fig.subplots_adjust(left=0.07,right=0.9,bottom=0.15,top=0.91))
그림 오른쪽에 표시하는 핵심은 ax1.yaxis.set_label_position('right')인데, ax1.set_ylabel()에도 약간의 수정이 가해졌습니다. 오른쪽으로 갔으니 글자를 돌려야 해서 rotation=-90이 들어갔고 (이게 없으면 기본은 "rotation=90"입니다.), 그렇게 돌렸더니 축에 너무 붙어서 lablepad=12로 여백을 줬습니다. y축 이름표를 오른쪽으로 보내면 "va='Top' or 'Bottom'"이 작동을 안합니다. 그래서 "labelpad"를 이용하여 위치를 조정해주어야 합니다. "labelpad"의 숫자는 픽셀 포인트를 의미합니다.
03.2. Text and Figtext
Text는 Axes에 속한 함수입니다. 따라서,
ax1.test(0.5,15.,'Normal Text')
이렇게 실행됩니다. Axes에 속한 함수들은 대부분 위치를 데이타 기준으로 잡습니다. 즉, 위 예는 x=0.5, y=15인 좌표를 기준으로 Text를 표시한다는 뜻입니다. 위 그림을 자세히 보면, ha="left", va="bottom"이 기본으로 설정되었음을 알 수 있습니다.
Figtext는 plt(=matplotlib.pyplot)레벨의 함수입니다. Figtext의 가장 큰 특징은 글 테두리 상자를 자동으로 생성한다는 점입니다. 위 예에서는 상자의 색깔도 지정해보았습니다. 색 이름은 HTML에 사용되는 색 이름은 거의 다 바로 쓸 수 있습니다.
pos1=ax1.get_position().bounds  ##<= (left,bottom,width,height)
plt.figtext(pos1[0]+pos1[2]*0.05,pos1[1]+pos1[3]*0.85,'Text in Pink Box',backgroundcolor='pink',color='k',fontsize=12)
Figtext는 plt의 함수이기 때문에, Axes와 상관없이 종이 전체의 비율값에 글자를 쓰고 테두리 상자를 그립니다. 그림 상에서 임의의 위치를 비율로 정확히 집어내기는 어렵기 때문에, 여기서는 일단 정의된 Axes의 모서리 값을 불러옵니다. 그 후 그 모서리를 기준으로 적당한 비율을 움직여 위치를 잡아보았습니다.
03.3. Annotation
Matplotlib에서 제공되는 함수 중에 이렇게 화살표를 이용하여 그림에 주석을 달 수 있는 도구가 있습니다.
ax1.annotate(r'$y=x^2$', xy=(3., 9.),  xycoords='data',
             xytext=(3.5,4.), textcoords='data', size=12,
             arrowprops=dict(arrowstyle="->", connectionstyle="arc3,rad=0.5"),
             )
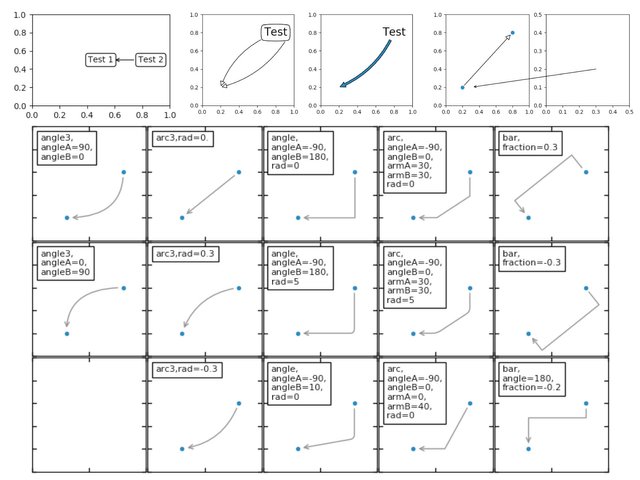
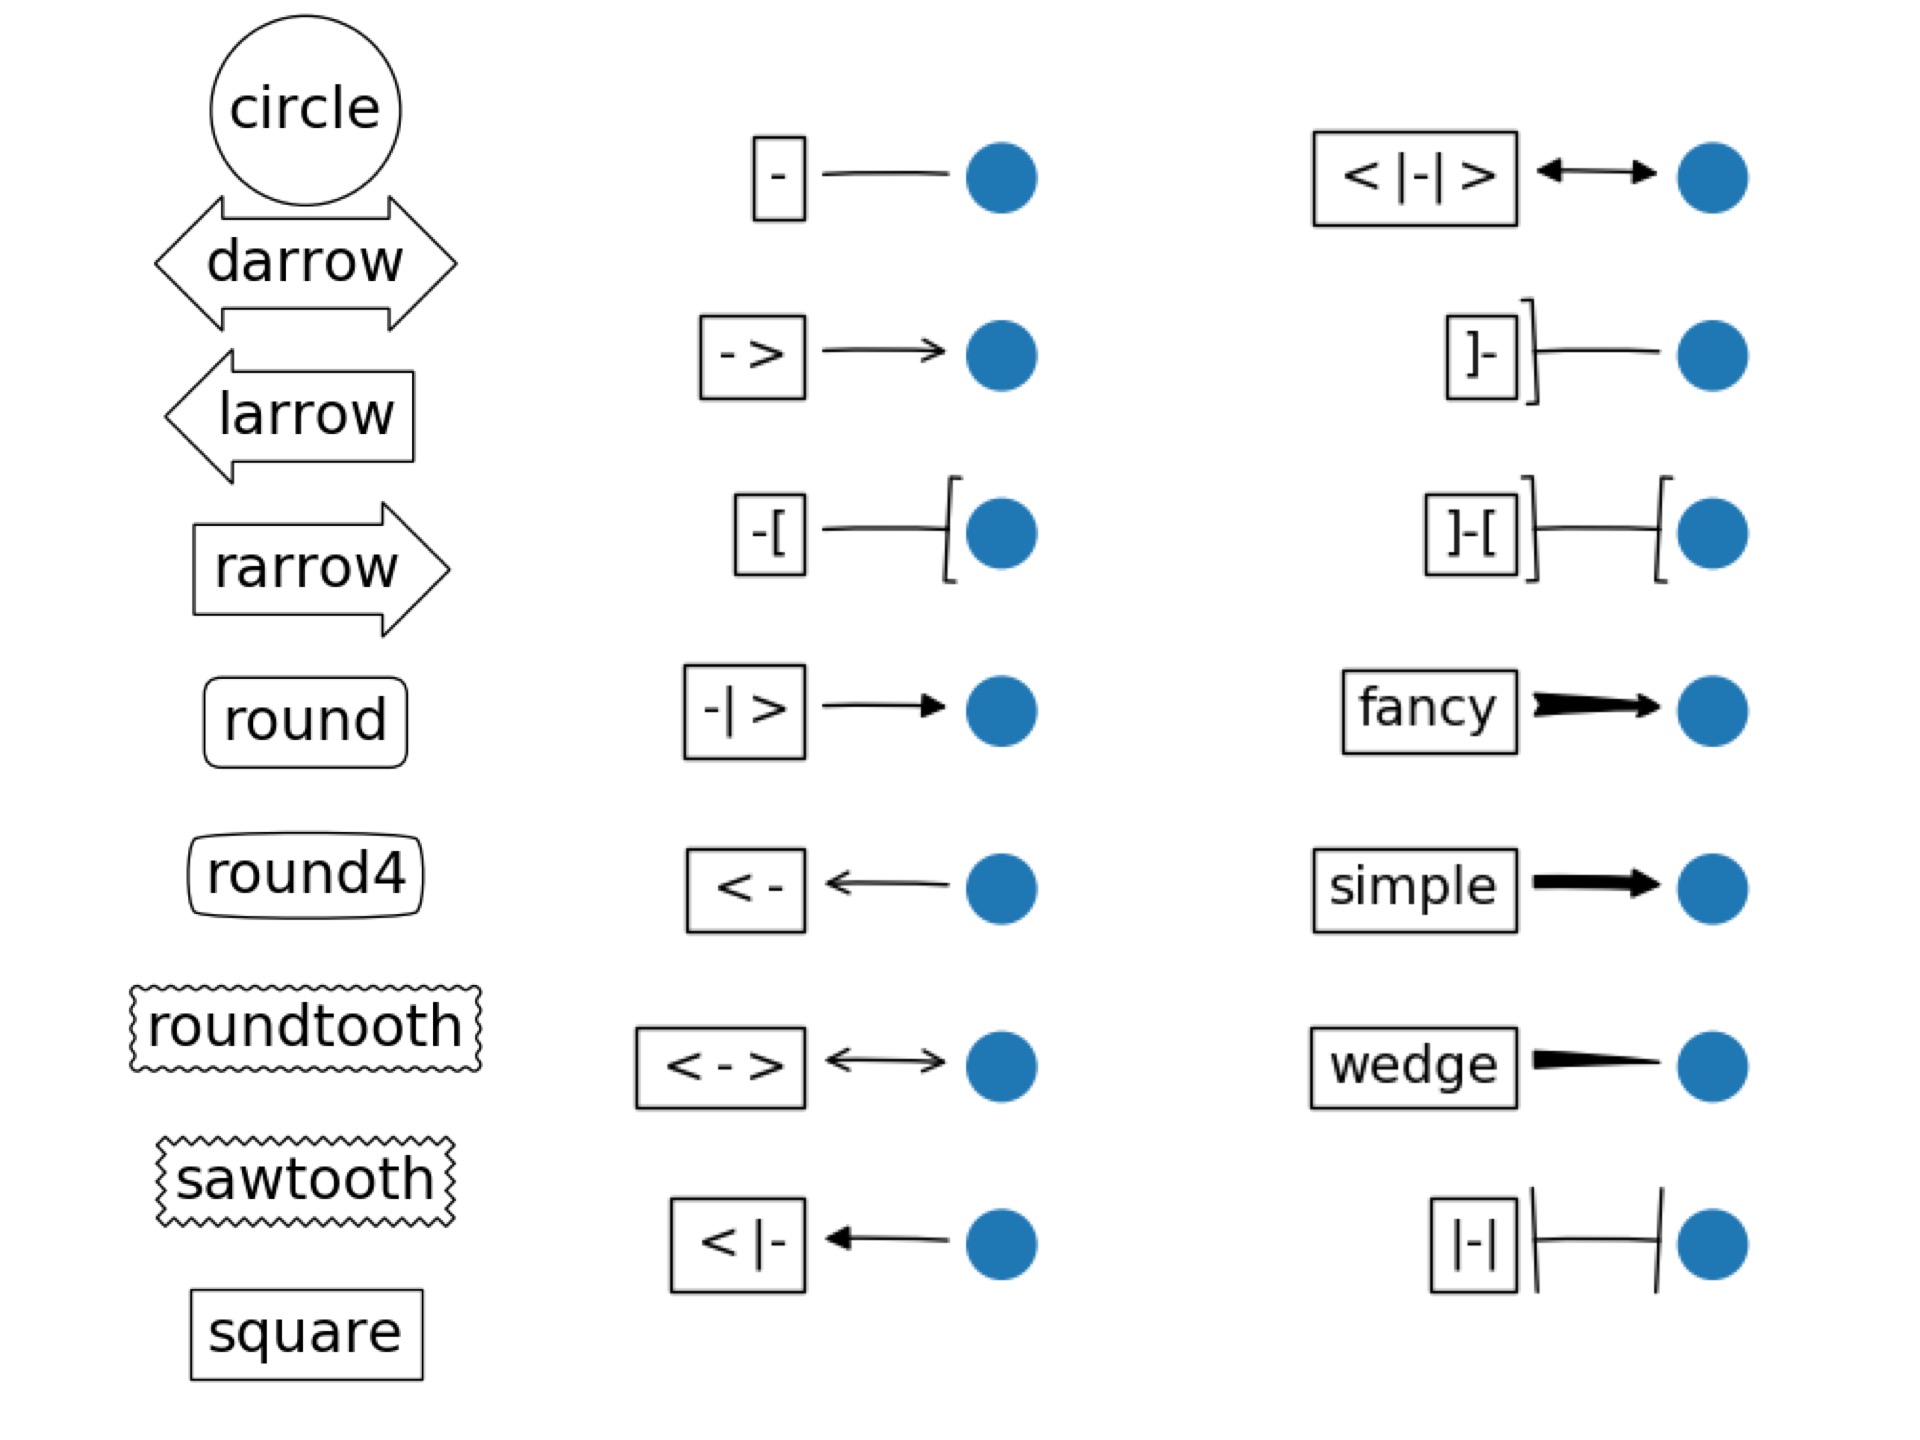
Anotate는 기본적으로 2개의 위치가 필요합니다. 하나는 Text가 위치할 장소이고, 다른 하나는 화살표가 가리킬 장소입니다. 위 예에서는 두 위치 모두 데이타 기준으로 설정되었습니다. ("xycoords='data'"; 그 외 다양한 방식이 가능합니다.) 화살표도 다양한 형식이 이미 정의되어 있습니다. 자세한 내용은
Annotation
Axes.annotate(*args, **kwargs)
matplotlib.patches.FancyArrowPatch
를 참조하시길 바랍니다.


Python 보다는 Matlab 코드 같아 보여요. ^^;
그래프가 많아서 그런가요? ^^;
나중에 그래프 그릴일이 있으면 도움을 요청할지도 모르겠습니다.
요샌 수치해석쪽에는 R이 핫하던데 그건 어떠세요?
Matlab을 아시는군요!
Python의 그림그리는 라이브러리 이름 부터가 "Matplotlib"에요. 즉 매트랩을 따라했다는 거죠. 당연히 비슷해보일거에요.
R은 아무래도 통계쪽에 특화되어 있는데, 저같은 경우 파이쏜으로 거의 모든 일을 할 수 있어서 굳이 R을 또 배우려는 동기가 안생기더라구요. 슬쩍 봤는데 둘 간에 좀 헷갈릴만한 문법도 좀 있구요.
matlab이야 워낙 독보적이니깐요....
전 이것저것 잡다하게 다루다 보니. ^^;
matlab은 라이센스 문제 때문에 부분적으로 가지고있는 코드들을 python으로 옮길까 하는데 올려주신 라이브러리를 활용하면 좋을 것 같아요!
python 코드 작성하실때 주로 사용하시는 에디터가 있으신가요?? :)
아, 막줄에 질문이 있었군요. 이제사 봤습니다.
전 그냥 emacs 쓰고 있습니다. 개인컴에서는 Atom도 가끔 쓰는데, 서버에서 직접 작업할 때에는 vi보다는 emacs가 나아서요. ㅎㅎ
This post received a 40% upvote from @krwhale thanks to @dj-on-steem! For more information, click here!
이 글은 @dj-on-steem님의 소중한 스팀/스팀달러를 지원 받아 40% 보팅 후 작성한 글입니다. 이 글에 대한 자세한 정보를 원하시면, click here!