Examples of Candlestick Patterns in Crypto Trading - Part 1
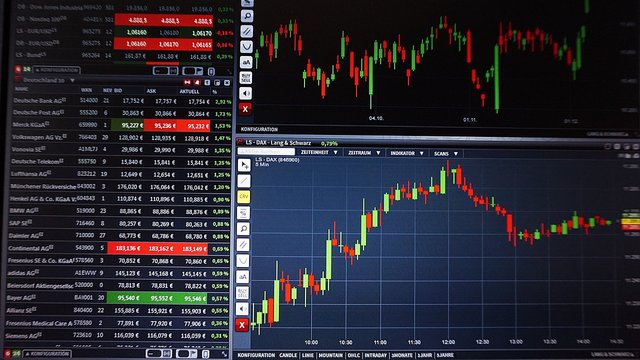
Let's consider an example of a bullish engulfing pattern in a cryptocurrency trading chart like following-
- Day 1: The first candlestick is bearish, with the open price at $10,000 and the close price at $9,500.
- Day 2: The second candlestick is bullish and larger than the first one. It opens at $9,600 and closes at $10,200, "engulfing" the body of the previous candlestick.
In this example, the bullish engulfing pattern suggests a potential reversal from a downtrend to an uptrend, as buyers have overwhelmed sellers, driving the price higher. Traders may interpret this pattern as a signal to enter a long position, anticipating further upward movement in the price.

Let us consider another example of a candlestick pattern.
Day 1:
The candlestick opens at $8,000 and reaches a high of $8,200 during the trading session. However, the price then experiences a significant sell-off, dropping to a low of $7,800. Despite the downward pressure, buyers step in, and the price eventually closes near the high of the day, at $8,150. The resulting candlestick has a small body near the top of the price range and a long lower shadow, resembling a hammer.
In this example, the hammer candlestick pattern suggests a potential reversal from a downtrend to an uptrend. The long lower shadow indicates that despite the initial selling pressure, buyers were able to push the price back up, potentially signaling a shift in momentum. Traders may interpret this pattern as a bullish signal. This is considered entering long positions, anticipating further upward movement in the price.
To be continued...
~ Regards,
VEIGO (Community Mod)


Upvoted! Thank you for supporting witness @jswit.