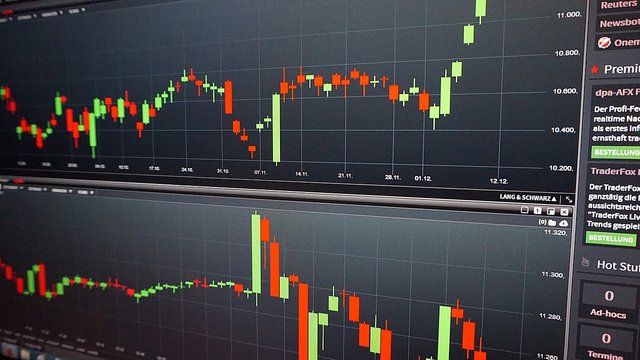
Components of Candlestick Patterns in Crypto Trading
This post is a continuation of the discussion with the previous post as in the previous post I only gave an idea about Candlestick Patterns. Today I will try to explain the matter with an example. If we understand something with an example, that matter gets embedded in our minds very well and that is why I am trying to explain the matter through examples. I am not a big trader but having been involved in this sector and cryptocurrency trading for more than six years, I am sharing my personal thoughts and some experiences with you and hope that through my posts, those who are new to this sector will learn something about this sector. Gain insights that will help them become pro users later.
Following is some Components of Candlestick Patterns-
- Doji:
A Doji candlestick has a small body, indicating that the open and close prices are virtually equal. It suggests market indecision and uncertainty about the future direction of the asset's price.
- Bullish Engulfing:
This pattern consists of two candlesticks, where the first candlestick is bearish (with a lower close than the open), followed by a larger bullish candlestick (with a higher close than the open) that "engulfs" the body of the previous candlestick.
- Bearish Engulfing:
Similar to the bullish engulfing pattern, the bearish engulfing pattern comprises two candlesticks, but in this case, the first candlestick is bullish (with a higher close than the open), followed by a larger bearish candlestick (with a lower close than the open) that engulfs the body of the previous candlestick. It suggests a potential reversal from an uptrend to a downtrend.
- Hammer:
The hammer candlestick has a small body near the top of the price range and a long lower shadow. It indicates that despite a significant sell-off during the period, buyers were able to push the price back up, suggesting a potential reversal from a downtrend to an uptrend.
- Shooting Star:
The shooting star candlestick has a small body near the bottom of the price range and a long upper shadow. It suggests that despite a significant rally during the period, sellers were able to push the price back down, indicating a potential reversal from an uptrend to a downtrend.
~ Regards,
VEIGO (Community Mod)


Upvoted! Thank you for supporting witness @jswit.
Learning technical analysis is good and I always enjoy reading your articles in which you share information about Technical analysis of.the market.