Demo trades of RUNEUSDT on a 4H time frame using Stochastic RSI Indicator
Greetings dear friends,
I welcome you to my blog today. We continue to learn daily and for that reason, we will be using the Stochastic RSI Indicator to analyze and enter the trade of RUNEUSDT on 4H timeframe today.
Please follow this tutorial closely and I believe you will gain something tangible in it. I'm not 100% sure of the analysis I make here because the market is not controlled by me but I follow some basic criteria to make my analysis.
It is expected that the market goes my way after considering a few confluences but due to news and other factors, it is possible that the market won't respect that in which case, that is what any good trader will do.
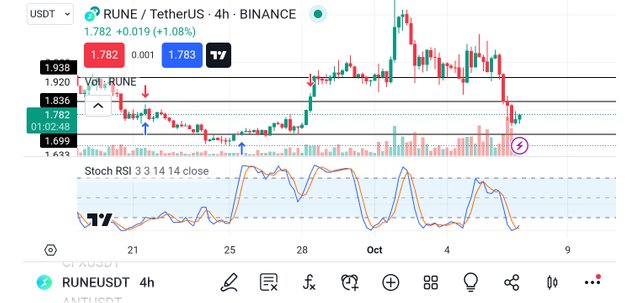
Considering the chart above, you will notice that the Stochastic RSI Indicator has reached its oversold region and it's reversing to the opposite direction.
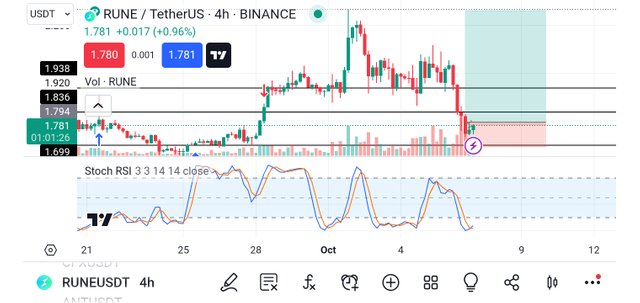
You can also see that the market closed the first 4H candle as bullish which means the market is changing direction. This also happened at the support level in the market which is a more reliable confirmation that the trend is changing.
I took the market after the closure of the first 4Hcandle which was bullish. The screenshot above shows the trade I have entered. From the image, you will notice that the trade is around a 2:10 risk-reward ratio.
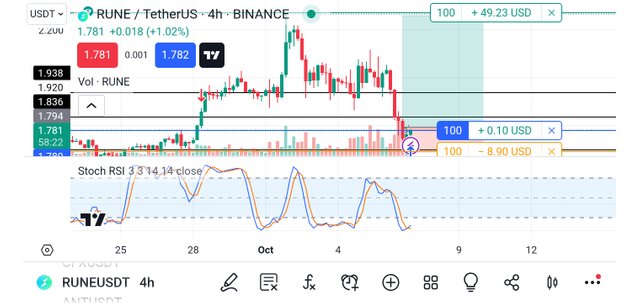
To be able to know what I will get from the trade since I'm still learning and trying to see the effectiveness of my strategies, I decided to enter a demo of the trade as you can see from the image above.
Already, the trade is currently in a serious profit which means the market respected my analysis. I would love to post the result of the market thereafter so that all of you will see how far the market later went. Recall that anything can happen in the market to make the direction change at any time.
This means I will need to check through the market often since a lot of factors now control the market. If you have any questions or contributions to the above analysis, please drop it as a comment in the comment section of this post.
Disclaimer: This post is made as an education and not investment advice. Digital asset prices are subject to change. All forms of crypto investment have a high risk. I am not a financial advisor, before jumping to any conclusions in this matter please do your research and consult a financial advisor.
Thank you, friend!


I'm @steem.history, who is steem witness.
Thank you for witnessvoting for me.
please click it!
(Go to https://steemit.com/~witnesses and type fbslo at the bottom of the page)
The weight is reduced because of the lack of Voting Power. If you vote for me as a witness, you can get my little vote.
Upvoted! Thank you for supporting witness @jswit.
Great analysis on RUNEUSDT using stochastic rsi indicator
This is an interesting post showing the demo trade analysis on runeusdt, thanks for sharing with us 😊👍
This is a great analysis you Have shared.
Keep sharing..