Demo trades of BTCUSDT on a 15M time frame using Trendline strategies
Hello guys,
It's another day of learning and I'm delighted to share with you all an improvement I have made in my analysis after attending some classes by some of the crypto analysts.
I have been analyzing the market in a way that hardly gives me to required profit but on this day, after learning more I think I have improved my analysis. That being said, I have analyzed this pair of trades and then waited for it to reach my level before entering.
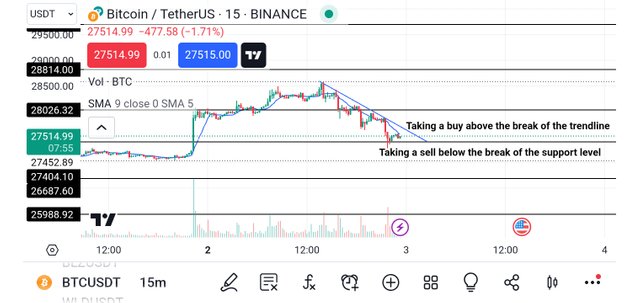
After looking at the 4H chart of this pair, I noticed that the market is on a downtrend because it has a long bearish candle all through. I went down to the low timeframe of 15M and I noticed that the market was making a series of low low and low high as you can see in the above image.
Seeing that, I decided to draw my trendline on the chart as you can see in the screenshot above. I also added a comment on it that says "taking a buy above the break of the trendline" or "taking a sell below the break of the support line". Those were the two alternatives to the trades.
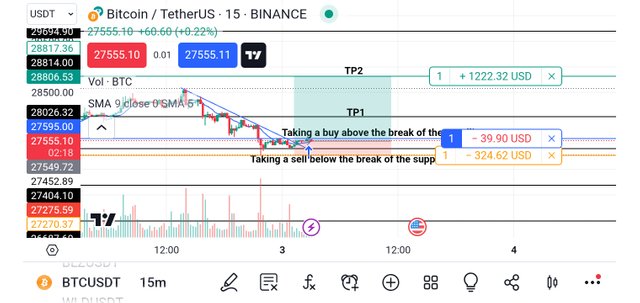
I waited for the trade for a while and it broke the trend line as you can see from the image above. I immediately took a buy-entry in the market. I placed the take-profit somewhere at the first and second resistance levels to serve as TP1 and TP2 respectively.
I watched the market go in my direction as I had earlier predicted. Though not at once because you will notice it going against me from the above screenshot it's a normal reversal that the market does before moving in the predicted direction.
I also didn't greed the market because my stop loss was right below the last low wick in the support level. From the trade, I think the risk-reward ratio is about 10:200 which is a very good risk-reward ratio. If the market goes in my direction then I should have a profit of about 200% but if it goes against me then I should lose just 10%.
Trading the trendline is a very important trading strategy that is used by almost every crypto trader in the market today. The strategies are simple as you can see in the chart I presented above. All you need is to follow the instructions carefully.
I hope this article adds something meaningful to your trading career, if you have any questions or contributions, please use the comment section of this post and I will gladly attend to it ASAP. Thank you all once again for your support.
Disclaimer: This post is made as an education and not investment advice. Digital asset prices are subject to change. All forms of crypto investment have a high risk. I am not a financial advisor, before jumping to any conclusions in this matter please do your research and consult a financial advisor.
Thank you, friend!


I'm @steem.history, who is steem witness.
Thank you for witnessvoting for me.
please click it!
(Go to https://steemit.com/~witnesses and type fbslo at the bottom of the page)
The weight is reduced because of the lack of Voting Power. If you vote for me as a witness, you can get my little vote.
Upvoted! Thank you for supporting witness @jswit.
Nice analysis on BTCUSDT
Demo trades of BTCUSDT on a 15M time frame using Trendline strategies is a great content.
This is an interesting post on demo trades of btc usd that you have performed.
Keep it up friend 👍👊