Candles patterns that identify Trend Reversal. (Morning and Evening Star ✳️)
Another trend reversal pattern I will like us to look into today is the morning and evening star ✳️. As I have promised, I will discuss in detail all the trend reversal patterns I listed in the article I published a few days ago. This is to help us have a wide knowledge about this trade pattern and also take advantage of them anytime we see them in the market.
Trading is not gambling hence you need to understand a few things in other to be a successful trader. I'm not saying that once this reversal pattern shows up, the trade must reverse. Sometimes it may reverse but other times it won't just know that the essence is for reversal.
There are times when banks and institutional traders may decide to shift the market to their test and during that period these rules may not be respected. They are always there for the takeout price movement so that they can take maximum advantage of the small traders. That being said, let's look at the chart pattern for this class.
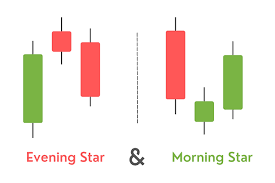
Morning Star ✳️
As the name implies morning star, this is a chart pattern that is usually seen at the support level of a trade i.e. it comes into play after a downtrend movement. The appearance of the morning star shows that the downtrend is over and the uptrend is about to begin.
Morning Star is made up of 3 candles 🕯️ sticks I.e a bearish candle, a Doji candle and a bullish candle. Whenever you see these candles in a support level or during a downtrend movement it means that the downtrend is over and a new trend that is an uptrend is about to take over.
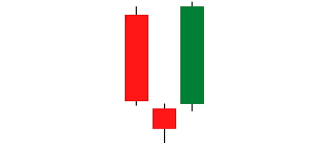
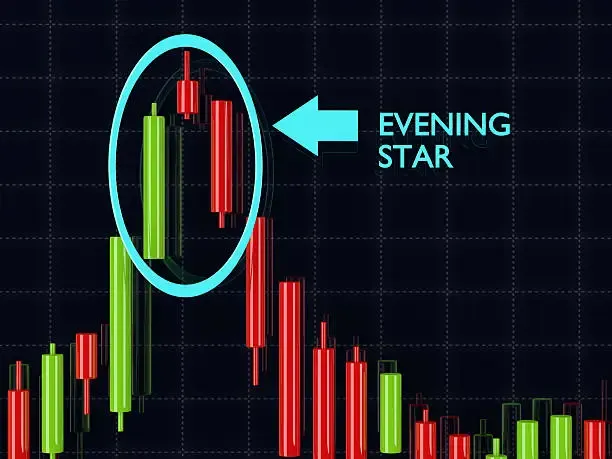
Evening Star ✳️
As the name implies evening star, this is a chart pattern that is usually seen at the resistance level of a trade i.e. it comes into play after an uptrend movement. The appearance of the evening star shows that the uptrend is over and the downtrend is about to begin.
Evening Star is made up of 3 candles 🕯️ sticks I.e a bullish candle, a Doji candle and a bearish candle. Whenever you see these candles in a resistance level or during an uptrend movement it means that the uptrend is over and a new trend that is a downtrend is about to take over.
I want to believe my explanation of these patterns is quite easy. As I have said earlier, trading is not gambling hence if you know this pattern and then apply them, you will be profitable in your trading journey. A successful trader is one whose profit is higher than his losses. So do your research and try to apply what I have written here so that you end good money while trading the crypto market. Thanks for your time.
Thank you, friend!


I'm @steem.history, who is steem witness.
Thank you for witnessvoting for me.
please click it!
(Go to https://steemit.com/~witnesses and type fbslo at the bottom of the page)
The weight is reduced because of the lack of Voting Power. If you vote for me as a witness, you can get my little vote.
Upvoted! Thank you for supporting witness @jswit.
You have given us a unique candle pattern that identifies trend reversals.
Thank you for sharing with us 😊
You have explained candle patterns very well. I didn't understand them that much before. Thanks for sharing such a post.
This Candles patterns that identify Trend Reversal is a great content.