Technical science on btcusdt chart and expected price range
Today I will be looking into the price chart of btcusdt and looking at what might likely happen based on what the chart is showing, my analysis is based on the weekly and daily timeframe these two time frame I believe tell the whole picture.
For the paste weeks we saw the market decline steadily with Bitcoin hitting a low of $53,485 according to data from trading view and this dump affected not just Bitcoin but every other cryptocurrency asset we saw them all decline though for a week or so it seems we are in for a recovery Bitcoin already at $67k which no doubt in time would bode well for other cryptocurrency asset.
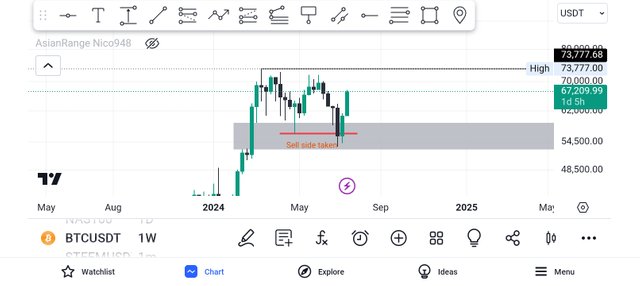
Screenshot from trading view
The image above shows btc on the weekly and we can see that despite the dump we found support on the weekly fvg which held though the previous low was taken out, as Bitcoin decline it took out the sell side liquidity a previous low which touched the fvg and this time around the previous low of $56k was taken and yet the price was still well within the range of the weekly fvg which span from $52,600 to $59,000.
Ever since that sellside at $56k was taken supported by the fvg Bitcoin has since bounced back and we have seen a weekly bullish candle closed off that range and another one closing soon just few hours from now as of when am making this post and this shows great bullishness in the price of Bitcoin and clearly the bulls have taken over, so I dropped to the daily to get a view of likey target and how it looked like in the chart.
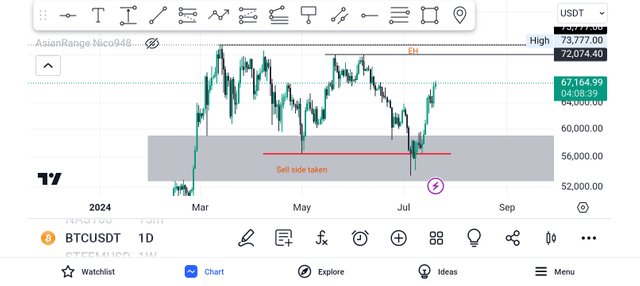
Screenshot from trading view
We can see clearly that weekly fvg on the daily timeframe and the sellside that was taken out and we have seen series of bullish daily candle formed on Bitcoin path to the upside and already on the daily we have seen the first high taken out, the high around $63k
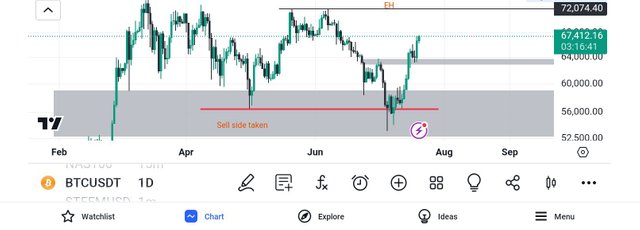
Screenshot from trading view
With the high on the daily around $63k taken out we noticed a retracement on the price and the high of that price level served as support and since Bitcoin has continued pushing to the upside, now what's the next target at this point?
Well the target is quiet clear first of we see the equal highs on $72k and that is clearly the place the target is drawing to, the likey next target for Bitcoin now is aiming to take out the equal highs on the $72k price level and price is steadily approaching or drawing towards that level infact at this point it is only a matter of time before this happens who knows maybe in the next week or two.
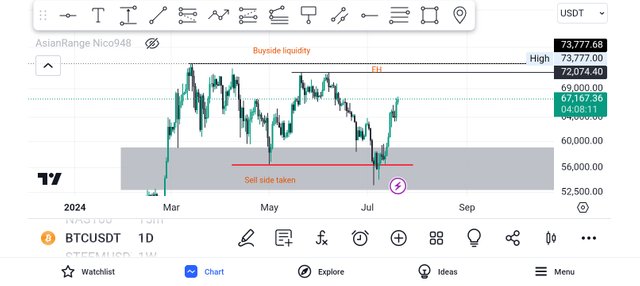
Screenshot from trading view
Ofcourse the $72k level buyside liquidity of equal highs seems an attractive place for price but then there is also a buyside liquidity at $73.7k price level that is a high we are likey aiming to take out which remains to be seen though for me I strongly feel based on analysis that we are going to draw to the equal highs on $72k personally my money is on that price level been taken out.
My analysis, thanks for reading through.
This post is not to be mistaken for a financial advise, everyone should make their own research and invest wisely
https://x.com/frank_anayo/status/1814767205638414676?t=XhNshw7hdFNLDOEC9J0wNw&s=19
Upvoted! Thank you for supporting witness @jswit.
You have explained the technical analysis for the Bitcoin price in USDT pair so do you think that Bitcoin is going to cross 70K this month?
I like your analysis bro Your charts and data suggest a potential uptrend in Bitcoin price. WE ALL are praying fro this and Also For Alt Coin .