SIZ Approved Course ||IT-Tech|| Data Analysis ||Lecture 03||20% payout to @siz-official || by @cryptokethor 31-10-2021
Asslam-o-alekum!
"Hello my All Steemian's"
How are you guys, i hope you are all well and me also fine allhamdulillah....
First of all I would like to thank this @siz-official community. And specially thank to community @cryptokraz , Who those built such a platform. In which all the people are moving towards progress with success.
Every successful person cannot achieve success unless he shares his abilities with others. It is only when we show our potential that other people can benefit from it. We are moving towards development within this community. It's not just about maintaining your potential. Rather, it includes every member who is ready for the good of himself and everyone. And especially the @owners and @members of this community, everything is possible with their cooperation. And hopefully, in the future, with the support of all members, this community will be a welcome development.
Being part of this community, I introduced my tutorial within this community. In which, I am extremely grateful to this community. Those who liked his first post ie the first lecture, ranked second among the top five posts. I am once again very grateful to this community, and to the honor of this community, who loved my first lecture.
Before moving on to today's 3rd lecture, I would like to share with you my previous 2 lecture.
Lecture No 1. Link
Lecture No 2. Link
"So let's start"
Lecture No. 3:
Data Analysis
What is data analysis?
Data Analysis, a lot of data, is to be described as a single platform, or a desktop. And it's the process of systematically applying data to define, get long, wide data, get it on a sheet, and check it. ... Actually all these tasks, usually by collecting data, compare the target and achievement through this whole process.
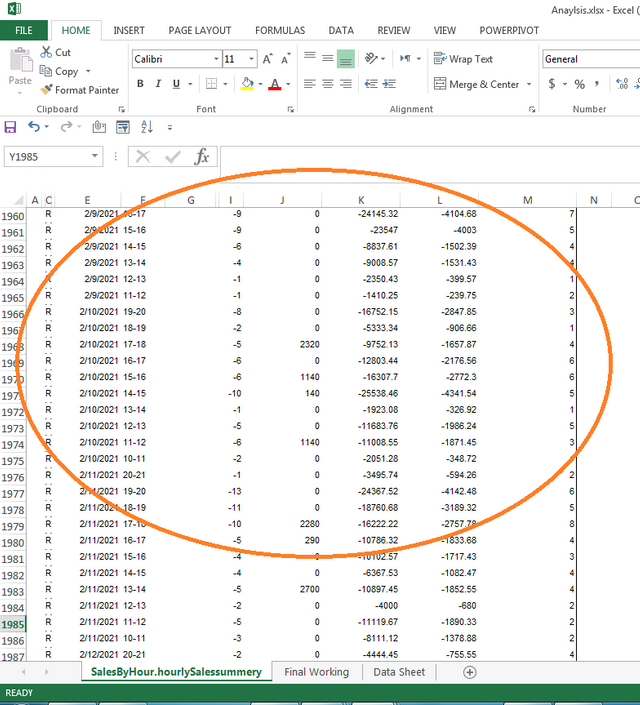
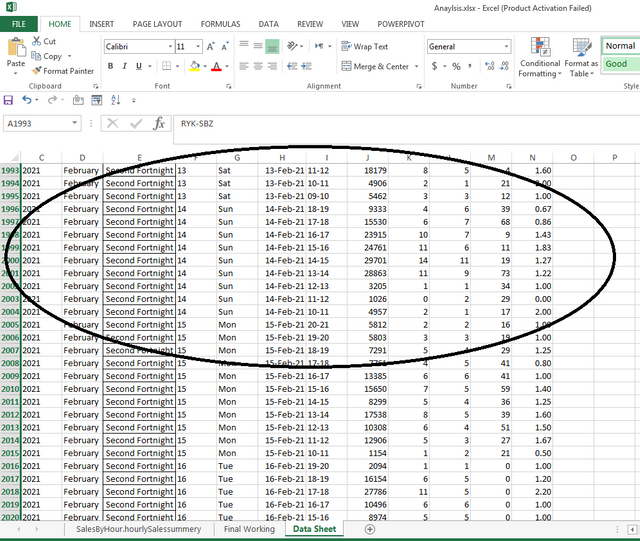
First we take the data sheet. Inside that is the data we see. It looks very simple. But it is very complicated. It contains data by year, month, day, hour and week. Which we have to look at within separate parameters.

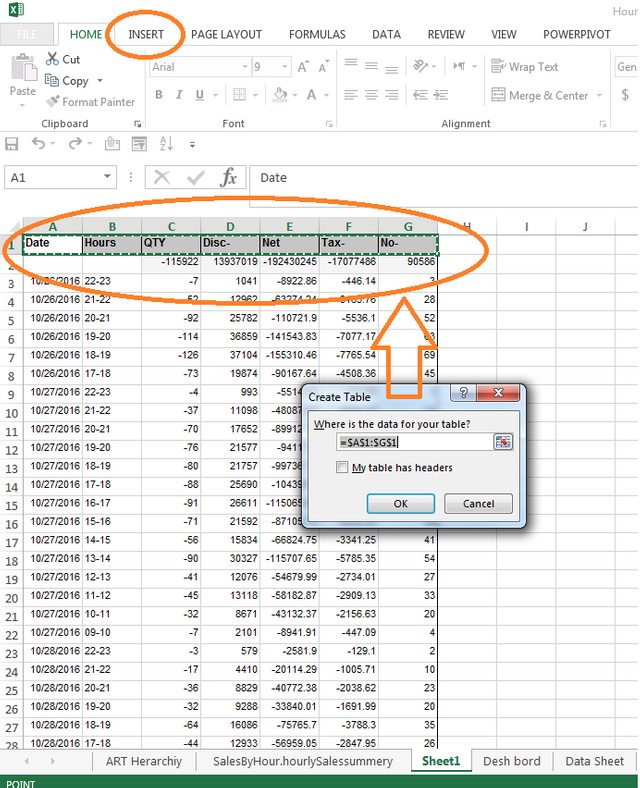
Then we create this sheet using the "Control + L" shortcut key's. Will design a format. Which is very important for applying slicer.
Then we will look at the top inside the sheet. Will go inside the home. From there will go inside the insert. On the right side, there will be a slicer button. We will go into it. Then the sheet inside the data will open. So all of these parameters will be visible. In which hours, days, months, years, targets, achievement minutes, all the data will be visible. From this we will have the data that we need, we will select it. Which you will see in a separate sheet.
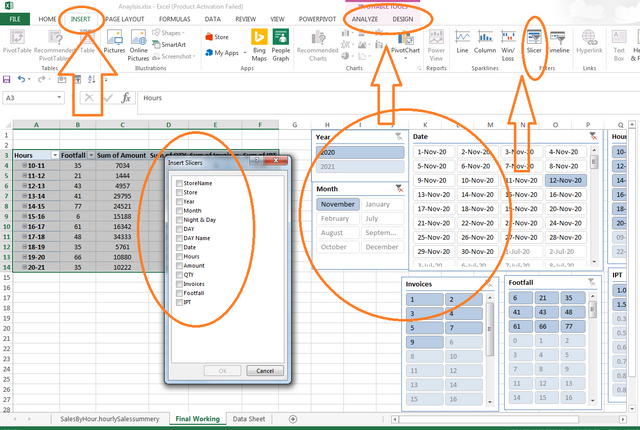
So this time we select only three categories like that date, hours and quantity.....
After selecting the data, showing like this formate.
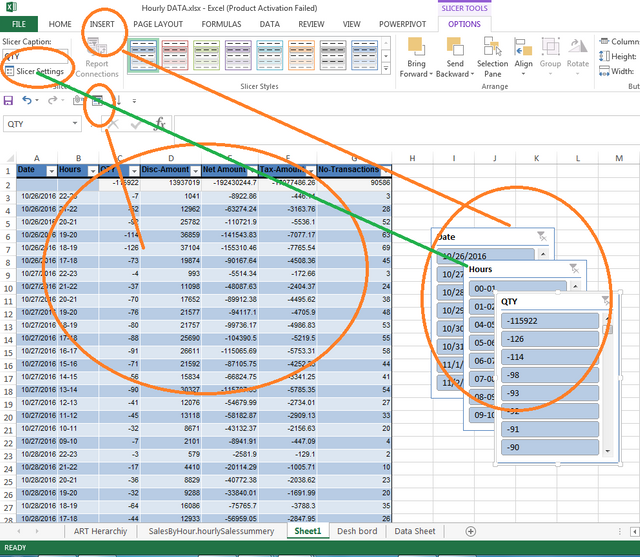
Now we can view the data as per our requirement. At this time I would like to see how many quantities were sold out in the first hour. So to see this, I'll select the first hour. So in front of me will be the data show.
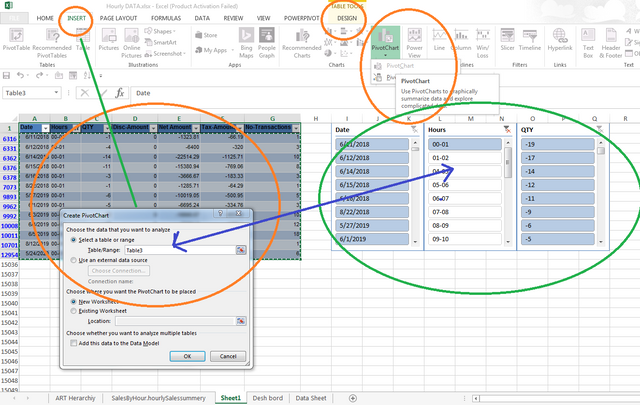
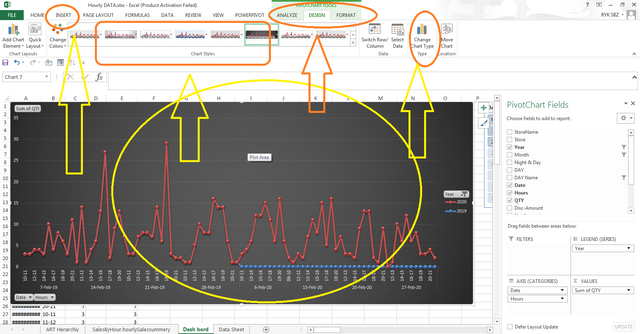
Then we have any data. In the graph case on a platform, to see. Will go into the insert. After going into the insert the graph will go inside the table. Going into it, we will select our desired graph.
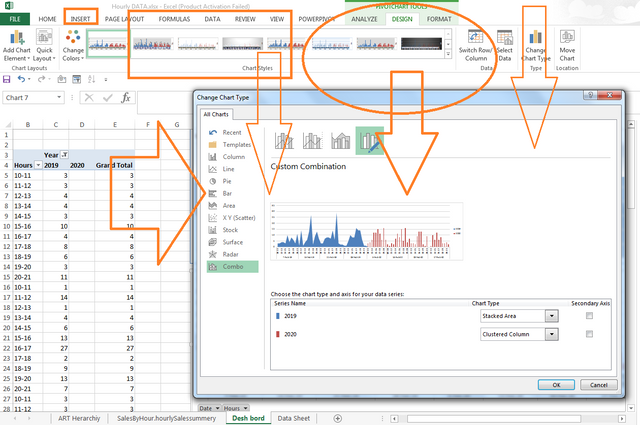
We can use different parameters to view our generated data, in the form of graphs. If we want to see it in the form of columns, we will select the column graph. If we want to see it in the form of combo, then in the case of combo. By selecting such a graph table, we can make it better and more beautiful.
Thanks for Visiting My Post If You Want To Know More About Me Follow This Link Below:
Special Thanks to...
@cryptokraze
@vvarishayy
@suboohi
@arie.steem
Regards @cryptokethor
Good post dear friend please make a justify your text because then your post is more valuable and attractive to see for everyone.
Regards, Faran Nabeel
thank you very much. That you appreciated my work, and explained for improvement.
Congratulations your post has been selected for booming support.
#club5050
I am very grateful to you. That you appreciated my hard work.