[Steem talk] Understanding Crypto Trading - Episode 8
What is this?
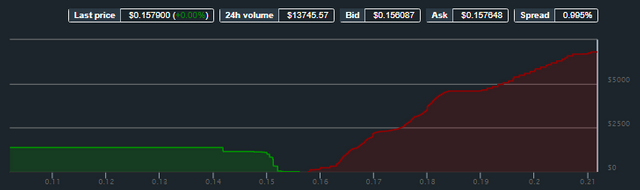
I don't know what is this called, but I call it a butterfly chart, where it has both side of the buy and sell power. Now do remember I have previously mentioned, buying the denominator! So, both side of this chart green wing and red wing both refers to the same denominator, which is STEEM in this case. It has all the important component in it that helps you decide where are the SUPPLY and DEMAND. Which we will explain a little bit of this later in the episode.
Why not candle sticks or line charts?
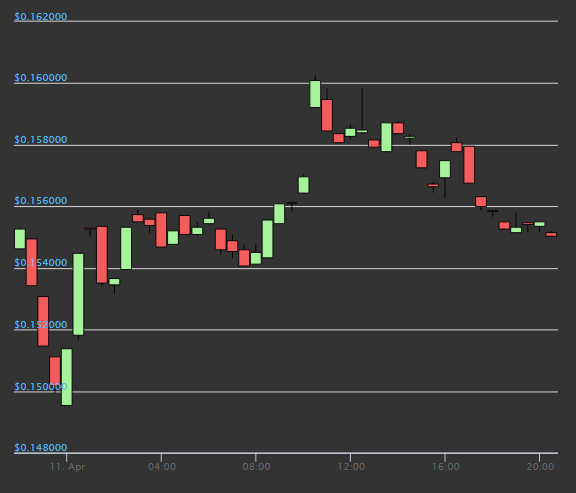
Originally captured from @coingecko
Here is a conventional candlesticks technical chart. What is so powerful about candle sticks chart is, it allow the people whom study technical analysis knows about over a period of time what is the market behavior like. It is very informative on each candles with precise open/high/low and closed price for that period of time. So, if the close price is higher than the open price, automatically the candle will show you in green color. Vice versa if the close price is lower than the open price, the candle will present itself as a red candle. Experienced technical trader can analyze the candle itself and study the behavior of how a candle closed on the previous period of time and make a very precise prediction of future. Note that I'm using the word EXPERIENCED technical trader.
Line charts?
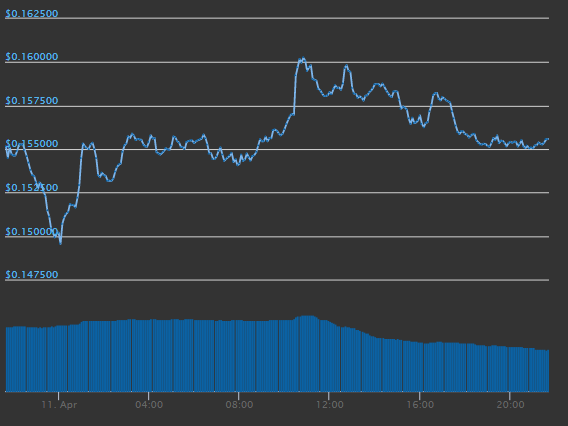
Originally captured from @coingecko
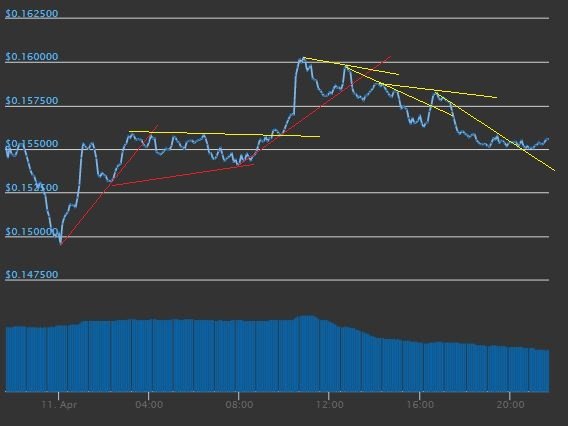
Line chart is generally using 1 single information across the whole period of time, and plot a dot on each period of time, joint them together and we see this line. This above chart are made out of a 24 hour. Once again, this can have a very brief knowledge in terms of trading breakout by recognizing the formation of the lines. Here is one of the simple strategy one can apply to trade with line breakouts. Let's have a look.
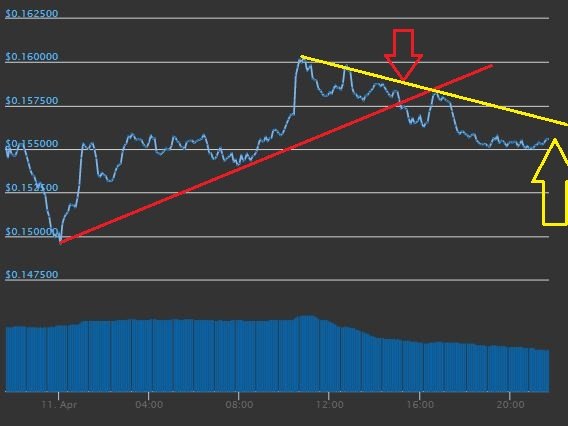
By connecting the low and the higher lows with a red lines accending,you will be able to form some sort of support trendline. Once the trendline is broken, it's pretty clear cut there's bear coming in. Vice versa, by connecting the high and the lower high decending, you'll be able to form a resistance line for a bear market. With that yellow line in place, it is easy to see when the market closed above and break the resistance, chances are a bull is coming in. Easy isn't it? You'll be saying, Dave you're genius!!! Well, this is simple knowledge can be obtained via Investopedia, do some reading if you're interested in studying it. I had enough of it for the past 20 over years. Because, in the end if you keep on connecting the dots, you're delving into the past too much and you start to lose yourself.
Do you see the contradiction now? In the end, it's very subjective. One technical analyst can make a trend line one way, the other experienced trader can make a totally different trend line.
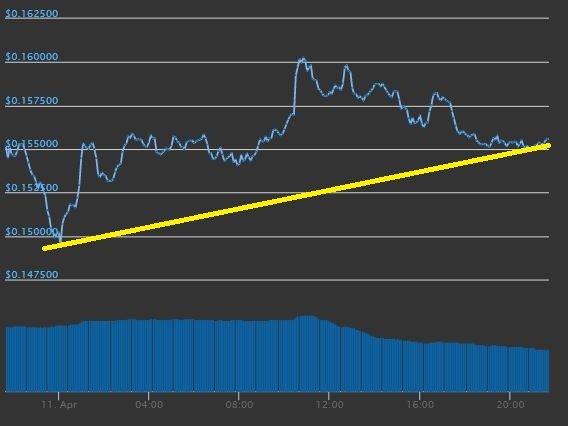
It could overall be ended up like this! LOL. So, tell me, what do you learn over the past few paragraph? I did not say technical analysis does not work?! Trust me, there are people who can trade very profitably with trend lines ONLY, they're that good at it.
Mathematics game
You see, all the above charts have one thing in common, which we do not realized. They're all associated with USD, the ever so great dollar. Whether it's going up or going down, dollar is there limiting your imagination. You couldn't set yourself free to see the bigger picture. Everyone is waiting for a chance to grab more USD when it's going up. Remember we have discussed this in our previous episodes, no high is too high, and no low is too low.
Once again when we look at our internal wallet, we will be able to see the butterfly again. It's a combination of volume, strength, price and everything in one place. The only thing it does not have, is the evil dollar. When you taken out the dollar from the equation, you felt helpless and do not know what to do with it?
To be continued
It's simple, because everything you needed is inside this one chart already. All you gotta do is find the balancing point, know which wing is bigger and you know which part of the demand is greater. We will come back and cover this part more when we have more people join in the discussion. And who knows, once we have enough believer in crypto, then we will come back and attack the evil dollar with our crypto!
Originally authored in another chain to suit that wallet
Previous Episodes
Part 7 here
Part 6 here
Part 5 here
Part 4 here
Part 3 here
Part 2 here
Part 1 here
Just back from a long unpublished vacation on steem. My husband, @oneray, explains to me about the internal market and he asked me to read the series you are publishing.
It is very good work that you do.
Thank you Mrs.Oneray. Please do keep posting on both #steem and "the other" platform. I find most if not all my contacts are still remain in #steem, but majority of the serious "money" already migrated there. So, it left me no choice but to continue to work on both side of the blockchain.
Thanks for the tip, @davidke20.
I will it.
As long as people do not find out why it is so important to learn about this subject, they will continue to be tied to fiat money. This also results in them not having in mind investing in their own steem account, neglecting the importance of this.
I'm waiting for your next installment, my dear @ davidke20; It has been easy to read and has clarified many doubts.
Thank you.
We will cover on the butterfly chart again on the next episode. For now, I think I will take some rest first. Happy Easter Sunday.
Lol, Good for you.
It's good to take a rest.
A hug, bro.
Thank you for your support. Here's a !shop as token of appreciation.
Hi~ 金鱼佬!

@bossku has gifted you 1 SHOP!
Currently you have: 43 SHOP
View or Exchange
Are you bored? Play Rock,Paper,Scissors game with me!SHOPPlease go to steem-engine.com.Quite interesting series you got going on !
There seems to be a Sell Wall and not much of a Buy wall at the moment... Quite scary.
Check out my Daily Crypto News if you feel like it.
Cheers and Stay Safe !
Best,
@vlemon
It has always been that way. We will come back to that part later to see why and how to NOT see it and still be benefited. I will drop by and have a look. Cheers !shop
Hi~ vlemon!

@davidke20 has gifted you 1 SHOP!
Currently you have: 1 SHOP
View or Exchange
Are you bored? Play Rock,Paper,Scissors game with me!SHOPPlease go to steem-engine.com.Friend excellent exposition, very explicit everything.
Helps to improve knowledge of the crypto market.
Once again thank you for your participation. Not only crypto market, these tricks applicable on other financial markets, including share market and currency market.
Here. Have some !shop
Hi~ fucho80!

@davidke20 has gifted you 1 SHOP!
Currently you have: 2 SHOP
View or Exchange
Are you bored? Play Rock,Paper,Scissors game with me!SHOPPlease go to steem-engine.com.Thanks for giving explanation to the chart, I am sure there are people do not understand the chart and your post will be a guide.
Thanks for stopping by. Happy Easter Sunday !shop
Hi~ oluwatobiloba!

@davidke20 has gifted you 1 SHOP!
Currently you have: 1 SHOP
View or Exchange
Are you bored? Play Rock,Paper,Scissors game with me!SHOPPlease go to steem-engine.com.