Multi-timeframe Analysis Of PEOPLEUSDT Using Support And Resistance Strategy
Source
Hello friends,
It feels great to be here again before you all in this community.
Here in this community I have so many friends and mentors and I will be proud to share my analysis again with them.
Today, I will be sharing my analysis with you all on PEOPLEUSDT.
The token PEOPLE is a good token in the cryptospace and I have decided to share an analysis I carried out on it today during my leisure.
During my leisure, I was making research as usual on various cryptocurrency project, and then I came across a good project and I have decided to make an analysis of it and share with my friends in this community.
From my previous analytical posts, you will notice that my analysis begin from the higher timeframe then I gradually move to the lower timeframe for entry.
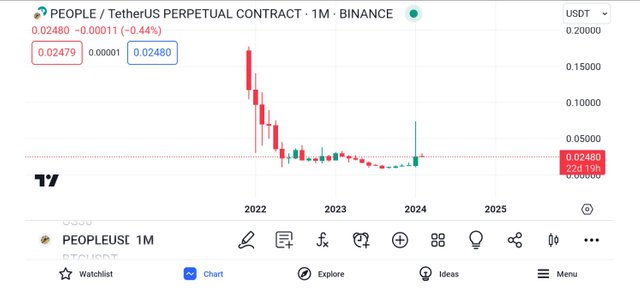
From the above screenshot, we will see the monthly timeframe of the chart PEOPLEUSDT, and on the chart, we can see the presence of both buyers and sellers.
The monthly timeframe has helped me to identify the overall market trend of the token, and from the screenshot above, we can see that PEOPLEUSDT is on a bearish trend.
I then decided to move to the lower timeframe for more analysis, and if possible the Identification of key market levels.
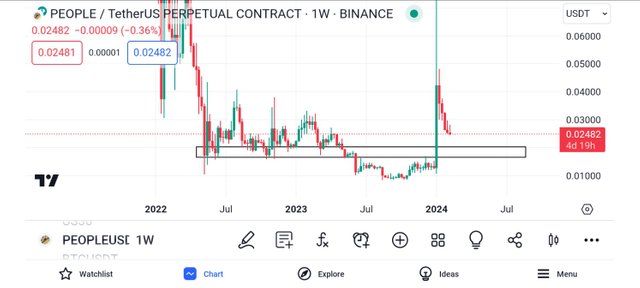
Moving to the weekly timeframe, I could see the market activities more clearly.
Here I can see more market candles representing the presence of buyers and sellers in the cryptomarket.
And on this, I was able to identify a strong support level on the chart.
On this level, the market has been severally rejected.
And when properly checked, we would notice that this level is being approached by price gradually, and when price gets to this level, we expect to see a market rejection.
Having identified key levels on the weekly timeframe, I then moved to the daily timeframe to check out market movement, and check for more analysis.
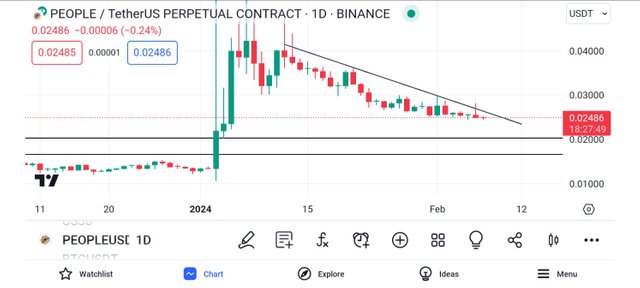
On the weekly timeframe, I saw more market activities, more bullish and bearish candles.
And on this timeframe, the bearish candles were more than the bullish ones, and as such, this market can be confirmed to be a bearish market.
I couldn't find a valid rectangular support/resistance but when I looked carefully, I was able to detect a diagonal resistance level, and this level has been severally respected by price.
Whenever the market gets there, the market gets rejected, and this is as a result of the selling pressure on that level.
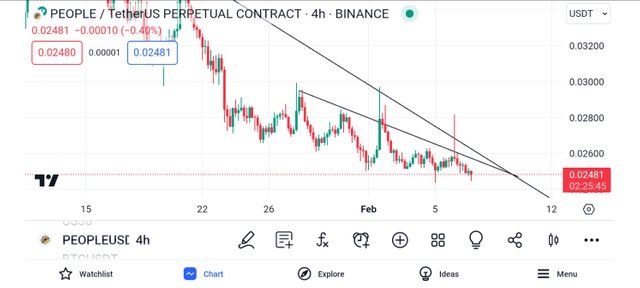
Moving to the 4hr timeframe, I was able to detect another key level on this timeframe.
On this timeframe, I detected another diagonal resistance level, and this level too has severally been tested and respected by market itself.
Whenever market price gets to this level, it gets rejected to the opposite direction.
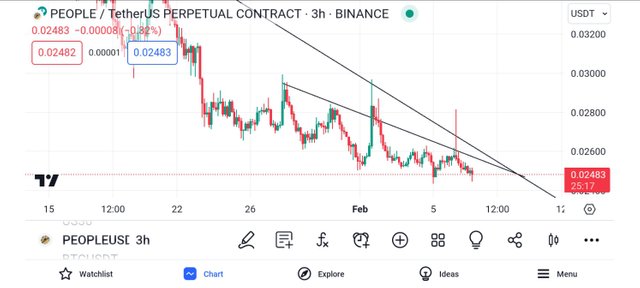
Then I moved to the 3hr timeframe. And on this timeframe, I saw same analysis as the 4hr timeframe.
The only difference is the time it takes for the formation of a candle, the candle on this timeframe takes 3hrs to be fully completed.
Then I noticed that this level has recently rejected the market, and I decided to move to the lower timeframe for entries into the market.
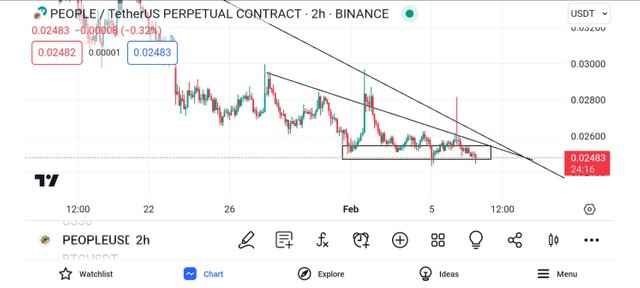
I then moved to the 2hr timeframe, and as seen above, is the chart of PEOPLEUSDT on the 2hr timeframe.
Then I spotted a very significant horizontal support level, and on this level, we can see that the market has been severally rejected.
Then we will also notice that the market just approached this level, and we expect to see a rejection to the upside when the market gets rejected to the upside.
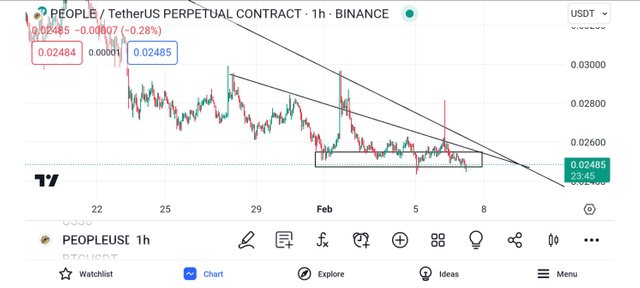
The chart formation on the 2hr timeframe is very much alike to that on the 1hr timeframe.
The only difference to the two timeframe that I noticed is the time period needed for the formation of a candle.
On the 1hr timeframe, it took a total period of 1hr for the complete formation of a candle, whereas the 2hr timeframe needs a total time period of 2hrs for the complete formation of a candle.
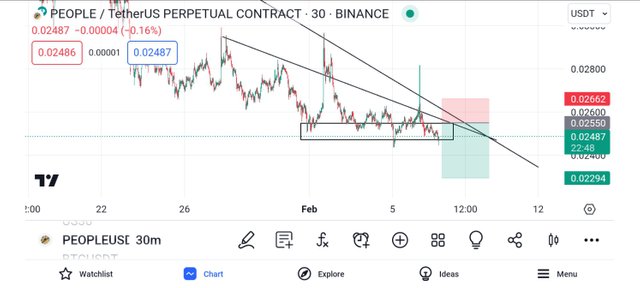
On the 30mins timeframe, I then decided to enter the market off the resistance level spotted in the market.
On this level, I expect to see a downward trend of market PEOPLEUSDT.
Thank you for going through my analytical post of PEOPLEUSDT
Thank you, friend!


I'm @steem.history, who is steem witness.
Thank you for witnessvoting for me.
please click it!
(Go to https://steemit.com/~witnesses and type fbslo at the bottom of the page)
The weight is reduced because of the lack of Voting Power. If you vote for me as a witness, you can get my little vote.
Upvoted! Thank you for supporting witness @jswit.
https://twitter.com/starrchriz/status/1755316324916457960?t=S2GXtqlwB7WnIZYLGt60GQ&s=19
Note:- ✅
Regards,
@theentertainer