Multi-timeframe Analysis Of MATICUSDT Using Market Structure

Hello friends,
It is my pleasure to be here today again in the presence of my friends and many crypto enthusiastes.
And as one of my favorite routine, I will be sharing my analysis on the popular token $MATIC and I will be making use of market structure as my analysis strategy.
And before then, let's learn a little about $MATIC.
$MATIC is the currency of polygon network which gives users the opportunity to interact with the network.
With this native token, users are being rewarded and other tasks can also performed using this currency in the network.
Today, I will be sharing my analysis begining from the monthly timeframe.
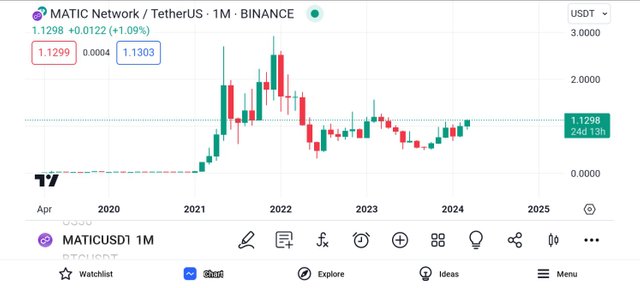
Displayed above is the screenshot of the chart maticusdt on the monthly timeframe.
And as expected of a price chart, it is to contain bullish and bearish candles, and this we can see clearly.
From the above screenshot which will be the highest timeframe I'll use in my analysis, I decided to detect the market trend.
And looking at the chart, I could notice that the market is forming lower lows and lower highs and these are features of a bearish market trend.
Using the strategy of market structure, we have what we call order blocks, and it is on this order blocks that we expect market reactions.
And on this order block also, we tend to depict when there is a change of market structure or a change of market character.
From the screenshot above, I was able to identify a key structure of the market, that when broken will depict a bullish move of the market price .
Then I continued my analysis by moving to the lower timeframe for more market information.
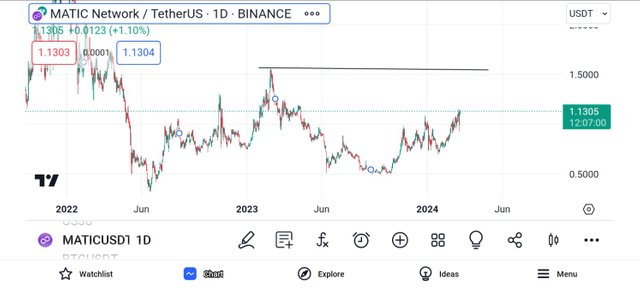
Moving to the daily timeframe, I could see more market activities, and when I looked carefully, I noticed a level that the market is approaching.
On this level is an order block, and the market is moving to mitigate the order block on this level.
When the market gets to this level, it is likely to break above that market structure or mitigate the order block and continue it's bearish move.
For more market details I moved to the next lower timeframe.
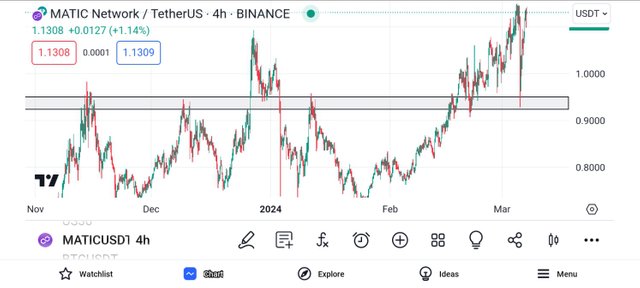
Then when I got to the 4hr timeframe, I saw lots of impulsive candles, both bearish and bullish.
And when I looked carefully, I was able to spot a level which has held the market severally.
I use to know it to be a support level but now I understand it to be liquidity in the market, and i expect the market to get to this level and sweep out the liquidity in the market.
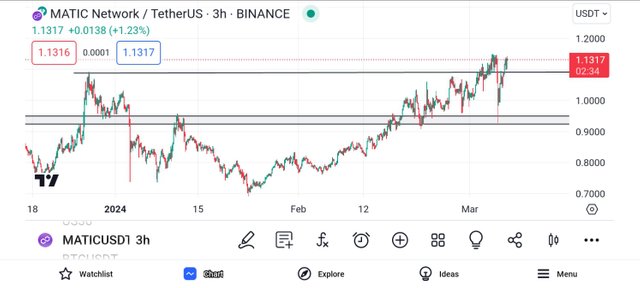
Moving to the 3hr timeframe, I could see more market activities.
I could see the struggle between buyers and sellers to drag the market to their preferred direction.
And I also noticed that the price came down to sweep market liquidity just as I have anticipated and it has continued on it's way upward.
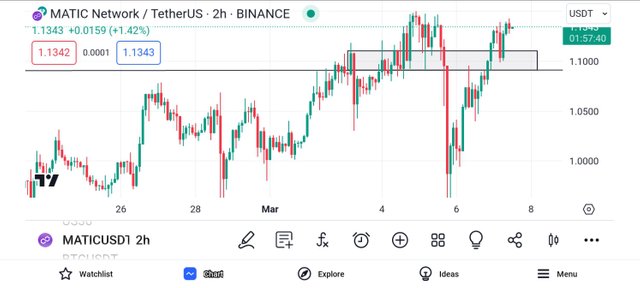
Then I moved to the 2hr timeframe, and i saw the market activities more clearly.
On this timeframe, I could see more bullish and bearish influence in the market.
And when I looked carefully at the market, I was able to detect a new order block which the market did not respect.
Having broken this level, I expect the market to retrace to mitigate this level, and when this happens, I can then join the market to the upside.
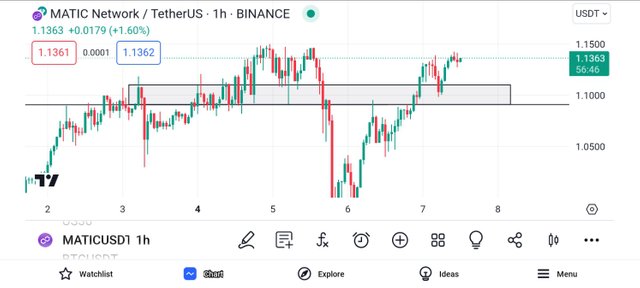
Then I moved to the 1hr timeframe t continue my analysis.
On this timeframe, i noticed that the market had mitigated this level already and has began its journey to the upside.
With this I was sure that the market was going to experience a bullish move, then I moved to the 30min timeframe for an entry into the market.
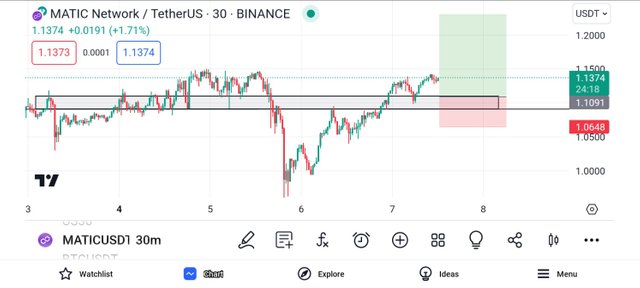
Moving to the 30mins, I then decided to join the market from the broken level.
From the chart, I expect to see the market retrace down a bit to mitigate this level again and then continue it's bullish move .
After entering the market, I decided to place my stop-loss below the broken level.
Thank you, friend!


I'm @steem.history, who is steem witness.
Thank you for witnessvoting for me.
please click it!
(Go to https://steemit.com/~witnesses and type fbslo at the bottom of the page)
The weight is reduced because of the lack of Voting Power. If you vote for me as a witness, you can get my little vote.
Upvoted! Thank you for supporting witness @jswit.
You've got a free upvote from witness fuli.
Peace & Love!
Kindly submit your twitter promotion link
https://twitter.com/StarChris002/status/1766164702457897284