Multi-timeframe Analysis Of ETHUSDT On Trading View
Hello friends,
How are you all doing today, I feel happy to come before this great community today to share my analysis on ethusdt.
Join me as we examine analysis ethusdt and predict the next market move.
As usual, I begin my technical analysis from the higher timeframe to the lower timeframe to identify and understand the trend of the market.
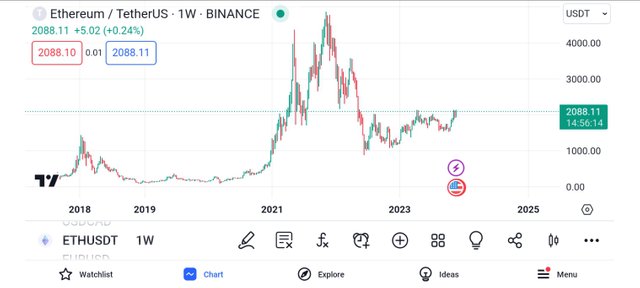
Today I decided to begin my analysis from the weekly time frame and from the screenshot above, you can notice that on the weekly timeframe, the trend of ethusdt is bearish.
And it is also seen that the buyers are trying their best to push the market upwards but the market has not been able to break some key levels.
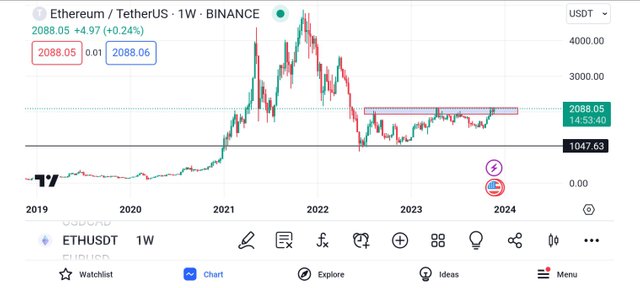
I then proceeded to identify key levels in the market, levels such as the support and resistance levels in the market.
As seen above, I have identified my support and resistance levels on the chart ethusdt, and my bias on the market is still bearish.
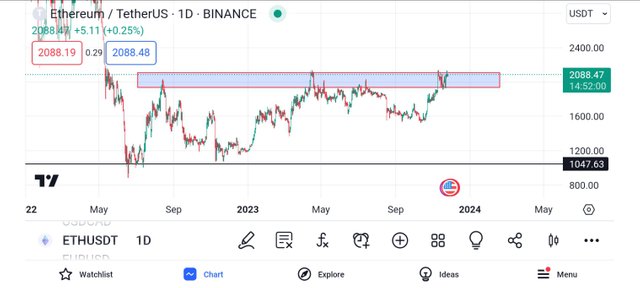
From the screenshot above, we can see that the market price has gotten to the resistance region I marked out.
The resistance region can be said to be valid because the market has respected this level severally.
I expect to see a rejection to the downside, and this usually happens when a market approaches a resistance region.
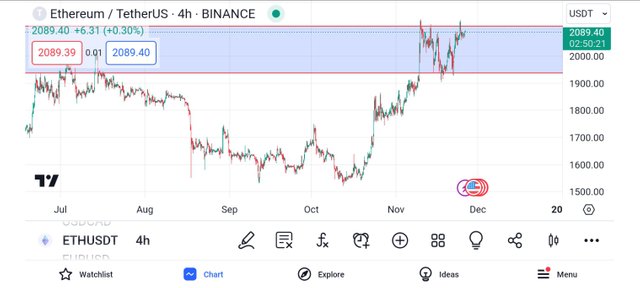
I proceeded to a lower time frame which is the 4hour timeframe.
And i noticed that the price was about to range within the resistance level I had drawn, and inside the resistance level, the market was on the resistance level.
Then my bearish bias continued and I decided to make use of an indicator to confluence my analysis.
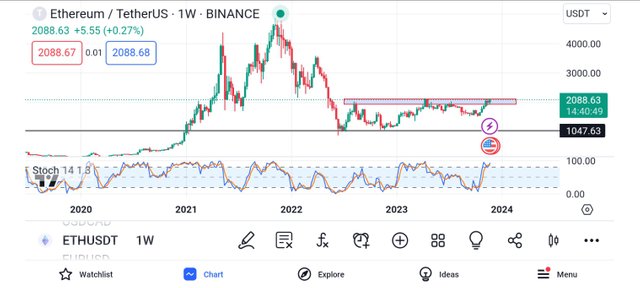
Then I proceeded to add my rsi indicator, and from the indicator, I noticed that the market is in an overbought region, and this is a signal for a bearish trend reversal.
This is a confluence on the higher timeframe that the market is preparing for a downward move.
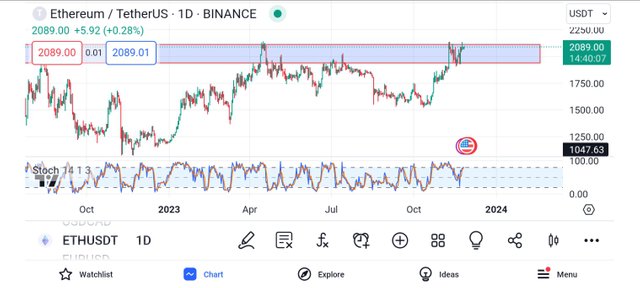
Then I proceeded to move to the daily timeframe with the application of rsi indicator.
From my daily timeframe, I noticed that the indicator is also on the overbought region, and this is signaling a bearish trend reversal.
And as I expected, the price is going to move downward, then I went to a lower time frame to search for my entries.
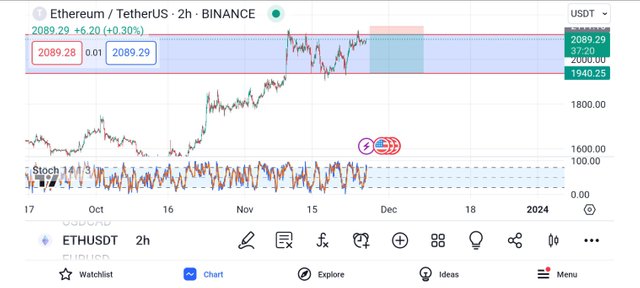
On the 2hr time frame, I got the same confluence I expected, and then I entered the market from the resistance zone and placed my stop-loss above the resistance zone.
In few hours, I will come back to check the progress of my analysis.
Conclusion
I have given my analysis on ethusdt on serveral time frame.
The information I provided above should not be taken as a financial advice, as all should make their own research.
See you all soon starrchris cares ❤️

Upvoted! Thank you for supporting witness @jswit.
https://twitter.com/starrchriz/status/1728790738832376241?t=Y6CDvhAfXH12aU0MDoZe-g&s=19
@starrchris, please add title and tag in your Tweeter Promotion post, it is completely blank
.
Ok boss,
Please what tag and title do u suggest bro
Title same as your article and tags like #steem #steemit compulsory and according to your topic.
Ok
Boss I will take correction
https://twitter.com/starrchriz/status/1729331149887938762?t=uHSwVQCTF5JXoVUddPrEYA&s=19
Okay boss
I wasn't aware
What topic and tag do u suggest bro?
You can make use of the compulsory tags like #steem #steemit $STEEM