Multi-timeframe Analysis Of BTCUSDT On Trading View

Hello friends,
How well do you love trading the cryptomarket? What strategy do you make use of and what is your target when trading the market.
Well, today I will be showing my analysis on btcusd on different time frame, in other words it can be called a multi-timeframe analysis.
Also, before I dive into my analysis, I will love to extend my warm regards to every of my friends in this community, including our hard-working moderators.
In my analysis of BTCUSD, I decided to begin from an higher time frame so I could understand the trend of the market.
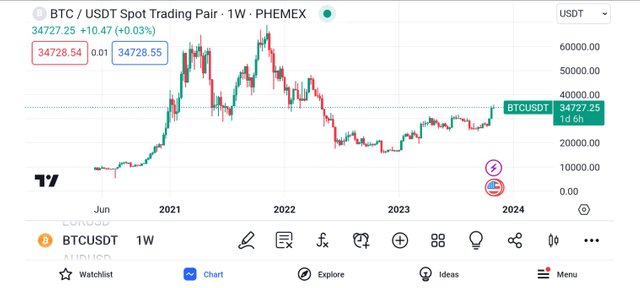
I went to the weekly time frame as seen above so I could get the overall market direction.
From the above chart, I could see that in the weekly time frame, BTCUSDT is still bearish, and this is because the price chart has been unable to make new highs, rather it consist of series of lower highs and lower lows.
I then decided to spot key levels in the market
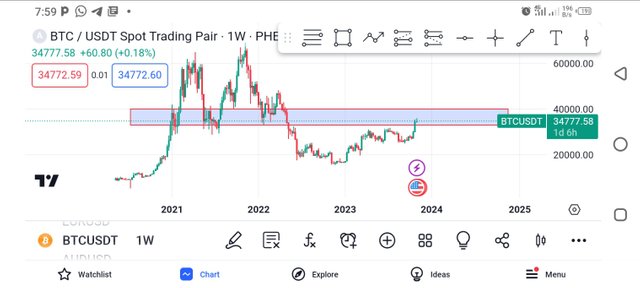
As shown above in the rectangular region is a strong level in the btc market.
The market has been reacting on that level, either to the upside or the downside, and this level is what we know as our support and resistance level.
Price has consistently bounced of this level, but at the current market price, this level is known to be a strong resistance level.
Checking the market, we could see that btc current price is on the resistance level, and it is expected for the price of btc to be rejected.
Whenever a price gets to a support/resistance level, it is expected to be rejected, and now I expect btc price to be rejected downwards, giving me a bearish move.
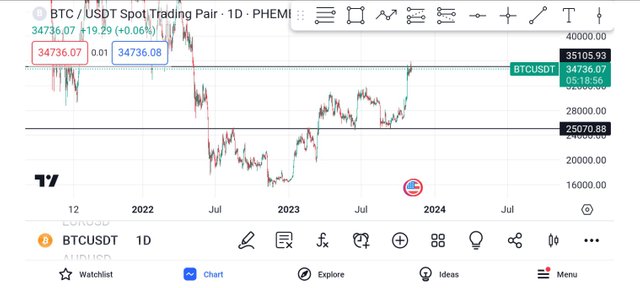
Then I went on to a lower time frame to get a confluence because price is fractal.
Price being fractal implies that whatever is happening on a higher time frame is also seen on the lower time frame.
Moving to a daily time frame, I could spot my support and resistance level very clearly which I indicated with an horizontal line.
As seen above, price reacted off this levels, so I decided to go to a lower time frame to look for an entry, since my bias for btc is bearish already.
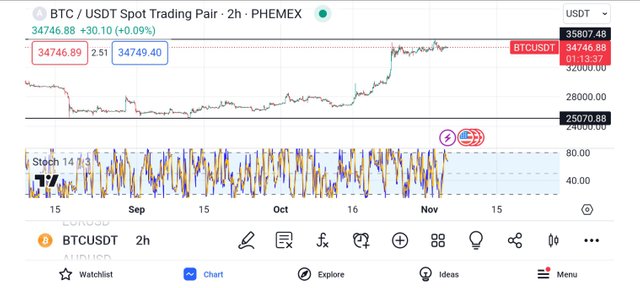
Moving to a 2hr time frame, I could see that price has already been rejected from the resistance level, and I saw this as a good entry confirmation.
Seen on the lower part of the screen is an indicator popularly known as stochastic indicator.
This indicator helps to detect overbought and over sold region in the market.
When the indicator is above the 80-line, it is indicating an overbought price, which is a bearish reversal signal.
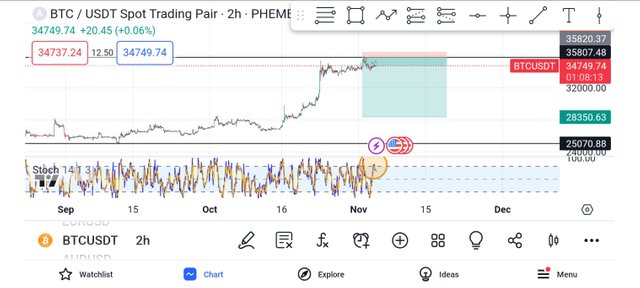
Spotting the stochastic indicator, we can see that it is in it's overbought region, and this is a good bearish reversal signal.
Seeing this, I took it as my needed confluence and I entered my demo trade for btc to experience a bearish move.
CONCLUSION
I have made my analysis on Bitcoin price and from my analysis, I am expecting a bearish move.
However, I recommend every user to make their own research as I am not a financial advisor.
All images used were taken from trading view except otherwise stated.
Thank you, friend!


I'm @steem.history, who is steem witness.
Thank you for witnessvoting for me.
please click it!
(Go to https://steemit.com/~witnesses and type fbslo at the bottom of the page)
The weight is reduced because of the lack of Voting Power. If you vote for me as a witness, you can get my little vote.
Upvoted! Thank you for supporting witness @jswit.
https://twitter.com/starrchriz/status/1720906030064758893?t=1S1y82gyRmJCttTz-zbtmA&s=19
Dear @starrchris ,
We appreciate your active participation and contributions to our community. To ensure a positive environment for all members, we have implemented a set of guidelines to maintain respectful and constructive discussions while upholding community guidelines.
This is an interesting analysis you have shared.
Let's see how the market goes.
Now Engage, Connect, and Inspire Each Other to Reach New heights.
Thank You.