All you need to know about the Vortex indicator
Greetings dear friends,
It's another week to share another interesting topic with you all. Today we want to look at a topic which I titled All you need to know about the Vortex indicator. In trading technical analysis tools are very important and that is why I focus on finding out different tools and there usecase.
Last time we looked at the Williams alligator 🐊 indicator which we talked about the three main parts namely the lips, the teeth and the jaw. If you missed out of that interesting indicator then I will advice you go through my blog and read through.

Today we are going to be looking at yet another wonderful indicator which is called the Vortex indicator. This is an indicator use to determine the beginning of a new trend or the continuation of an already existing trend. In summary we can say that this is a trend based indicator.
Every successful trader we see out there always ensure that the trend is his friend. You don't succeed in crypto or any financial market if you are counter trading that is trading against the trend. No one has ever gone against the trend and come out successful.
So for you to be a successful trader like others who share good profits and others in the various groups we belong, then you have to always trade with the trend. I will discuss indepthly about this trend and how to use it as we progress.

| History and composition of the Vortex indicator |
|---|
Just like every other indicator we may have learnt about, the Vortex indicator also has a history behind it and this history comprises of how it came about. Firstly, it is important to mention here that the creation of this indicator was done by two persons namely Etienne Botes and Douglas Siepman.
They didn't just start the journey from scratch they were inspired after seeing the impact or the usage of the ADI i.e the Average Directional Index indicator which was created by Welles Wilder. I have written about this indicator before but maybe for the sake of clarity and for those who don't know about I may write about it again.
This means that there are other indicators that gave them inspiration to go ahead to create the Vortex indicator. The Average True Range was also one of the indicators that inspired them as well. So you can see that before the the Vortex indicator creation, the ADI and the ATR played an important role that is inspiring the founders.
The indicator is composed of two lines which move above and below the centre. This two lines tell the trader when there is a trend change or when the trend is about to continue. So this is why we call it the trend based indicator.
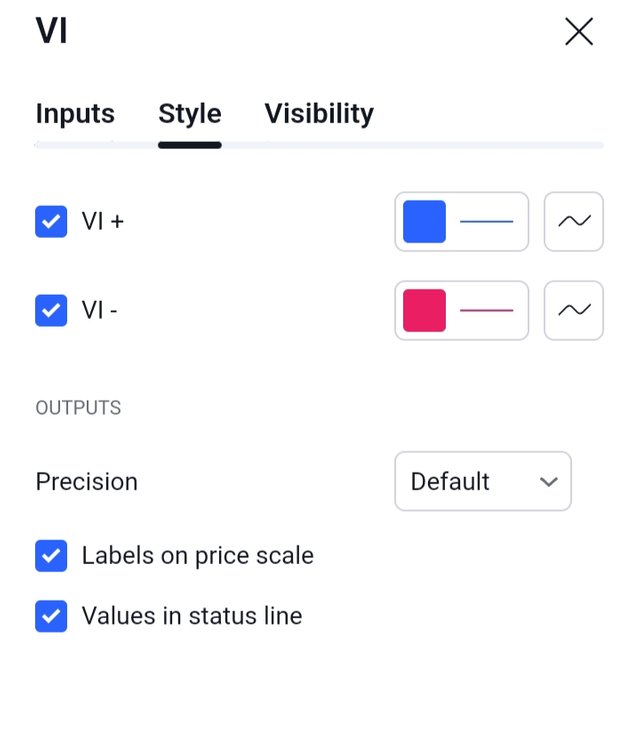
The both lines has a positive Vortex indicator represented as (VI+) and the negative Vortex indicator represented as (VI-). So here the positive line moves at the top of the centerline whereas the negative line moves below the centre line. The both combine to tell us the exact trend of the market at any point and time.
| Formula to calculate the Vortex indicator |
|---|
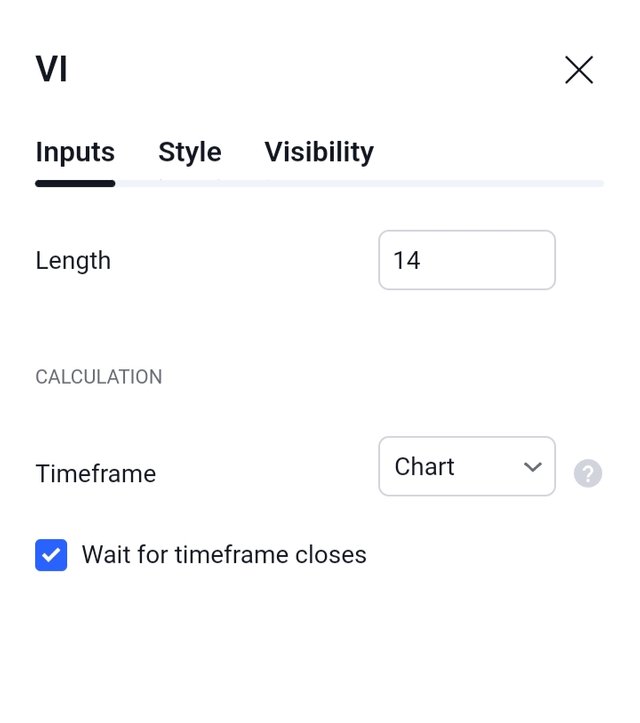
There are five main steps to calculate the Vortex indicator and I will be sharing it with us one after the other in this publication. You must follow the steps one after the other before you will be able to arrive in the actual value of the Vortex indicator.
Step 1: Calculate the High and the Low range. This can be symbolically represented as
High - Low (H - L)
Step 2: Calculate the True Range of the set of data given. You can do that using the representation below.
True Range: Max(H-L, Abs(H-Previous Close), Abs(L-Previous Close))
Where;
H-L is gotten from step 1
Abs(H-Previous Close) is gotten from given data
Abs(L-Previous Close) is also gotten from given data
Step 3: Calculate the Positive Vortex (VI+) by using the formula
VI+ = Sum of True Range (TR) in upward movement for a period given in the data.
Default period length = 14
Step 4: Calculate the Negative Vortex (VI-) by using the formula
VI- = Sum of True Range (TR) in downward movement for a period given in the data.
Default period length = 14
Step 5: Calculate the Vortex indicator using the formula
VI = (VI+) - (VI-)
Since we have two oscillator lines which are positive and negative, we also have the center which divides the both line and the value is usually zero. As you can see any number that is negative from our formula is ideal supposed to be plotted below the centerline and the positive line is supposed to be plotted above the centre line.
So after our calculation we can know if the trend is changing or it is a continuation trend. For instance if we have a positive Vortex indicator value which mean the trend is uptrend, we may calculate to find out the next move and we discover it is also positive then that is trend continuation for us. In the same way if the value changes to negative we will know that it is trend reversal.
In summary the key things to note while calculating the Vortex indicator include the period which is defaultly 14, the TR valua, the H-L and lastly the values of the VI+, VI-
 |  |
|---|
Also from the screenshot above you can see that the two lines have colour blue and red for positive and negative respectively. If the negative line is above the positive line then we will see a downward movement meaning negative line is above zero.
In the same way, if we see the positive line above the negative we will see an upward movement or an uptrend you will get to understand it better if you go through the chart I will be sharing with us below and the application of this to make a demo trade.
| Application of the Vortex indicator to demo trade |
|---|
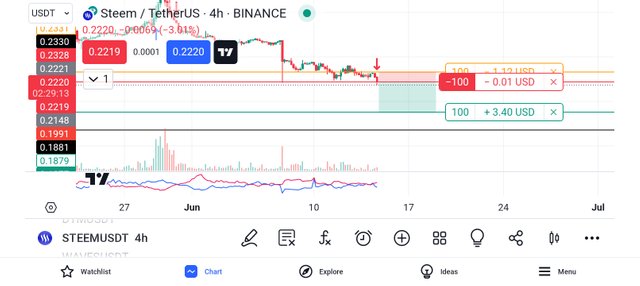
From the screenshot below, you can see that I have added the indicator below the chart and as you can see whenever we witness any crossing between the blue and the red oscillator lines there is always a trend change.
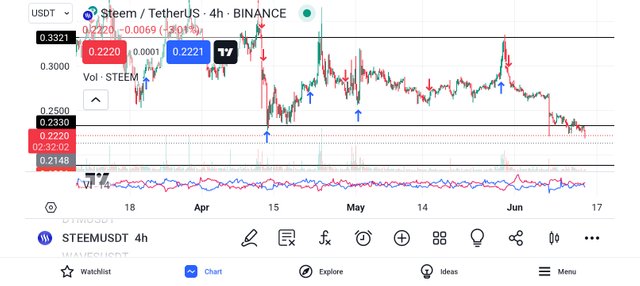
From the image above, you will notice the crossing of the line and the red line is seen above the center and above the blue line which is a clear indication that the market is going down. As a trend based indicator it has given me the direction of the trend.
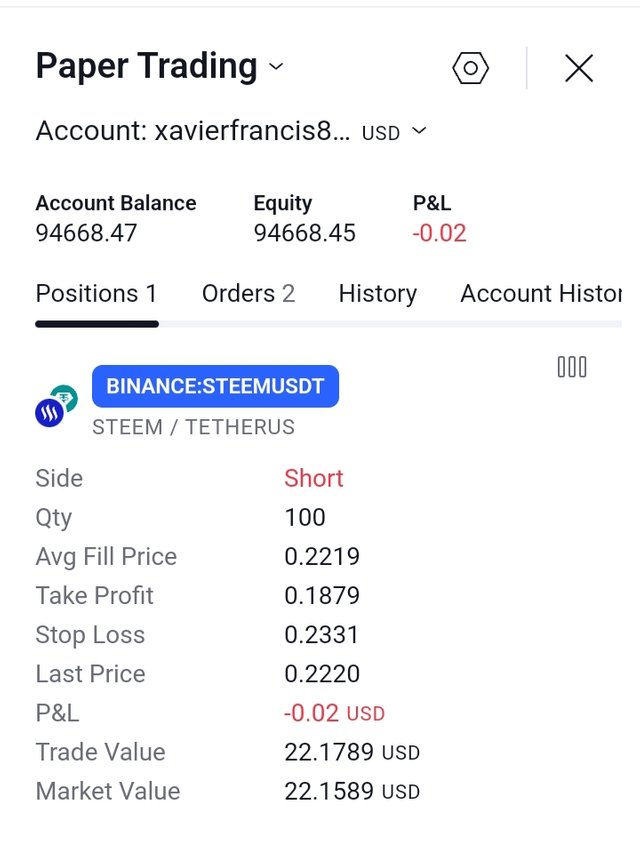
Since I know the direction of the trend I decided to enter the market to demo trade and test the strategy so I introduced my buy logo as you can see from the screenshot below. This is a demo trade but I still have to trade with caution.
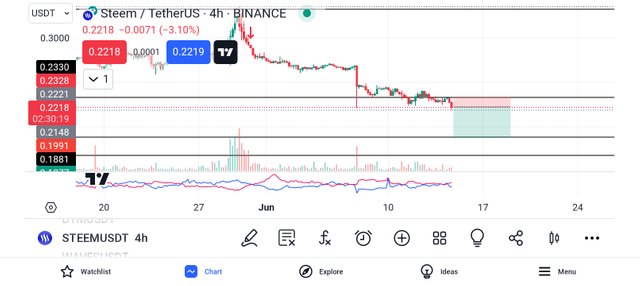
After that I activated my demo account for it to trade so that I can see the outcome of the result and the image below is the trade I placed and how it is running. I held the trade for awhile and then I went back to check thereafter if the market is going my favour or against me but no tangible move so I will keep you all posted on that.
 |  |
|---|
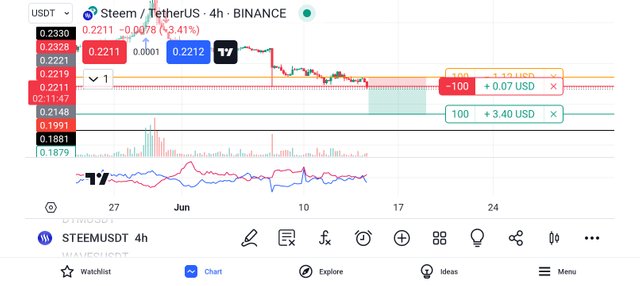
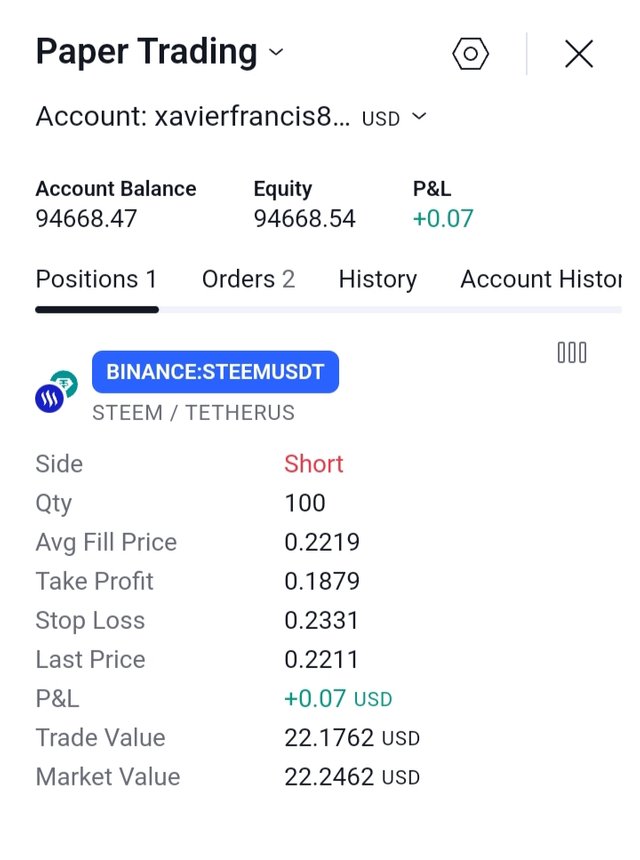
After a while I went back to the market and the results below is what I got which means that our analysis with regards to this indicator really worked out perfectly.
 |  |
|---|
Vortex indicator is a trend based indicator that tells us if the market will go in a certain direction or not. It tells us if we will have a trend switch or trend continuation. The indicator also has two lines and a center i.e the positive and the negative line. It has a default period of 14 though that can be changed but it's best to use the default though subject to your trading pattern.
Finally, I want to thank you all for reading through my post today. If you have any questions or contributions, please do well to use the comment section of this post. See you all in my next publication.
Disclaimer: This post is made as an education and not investment advice. Digital asset prices are subject to change. All forms of crypto investment have a high risk. I am not a financial advisor, before jumping to any conclusions in this matter please do your research and consult a financial advisor.
NB: All images except otherwise stated are mine and taken from the TradingView website.
https://x.com/xavierf14044615/status/1801678512195023148?t=4MrjWj2g880nWeFW9doBMw&s=19
Upvoted! Thank you for supporting witness @jswit.
Note:- ✅
Regards,
@theentertainer