Bitcoin its next movement | ANALYSIS

Good morning Hello Steemians Community: Steem Alliance.
Bitcoin its next movement | ANALYSIS
Bitcoin Price Analysis
In this section, the price of Bitcoin is analyzed and its future behavior is speculated on.
Current price and previous analysis.
1-) The current price of Bitcoin is $29,980.
2-) The price was expected to fall, but there is also the possibility of a sharp upward movement.
3-) The price is close to the resistance level at $30,000.
Technical analysis
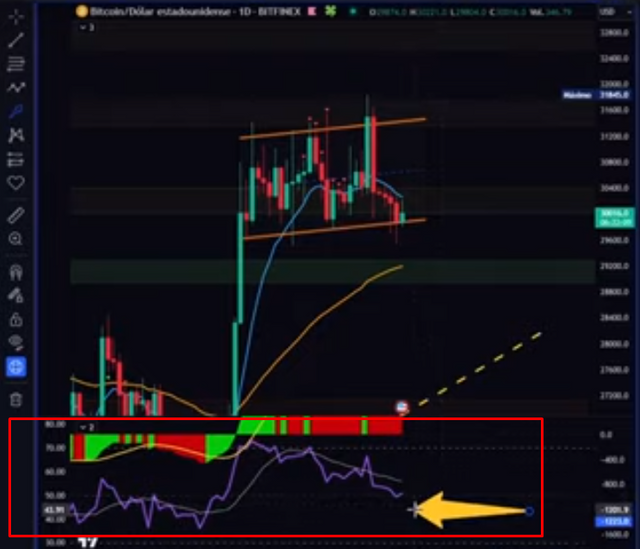
1-) On the daily chart, the price did not break the 50 level below, which indicates that there could be an upward movement.
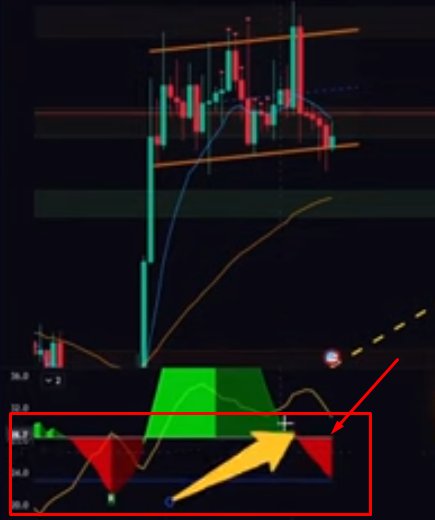
2-) There is a buy setup on the Squeeze Momentum Indicator (squeeze).
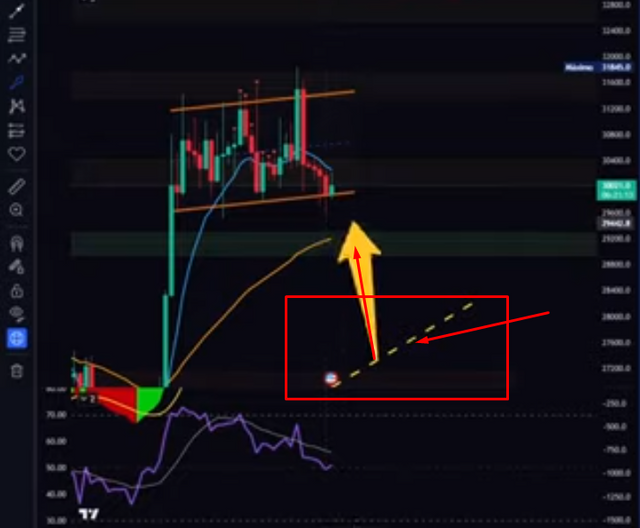
3-) The Magdi indicator shows a buy setup with the yellow line above it.
4-) The RSI can cross the 50 level to the upside, which would indicate a strong upward movement.
Future perspectives
1-) If all the technical setups materialize, it is possible that the price breaks the 10-period moving average in 4 hours and starts a bullish movement.
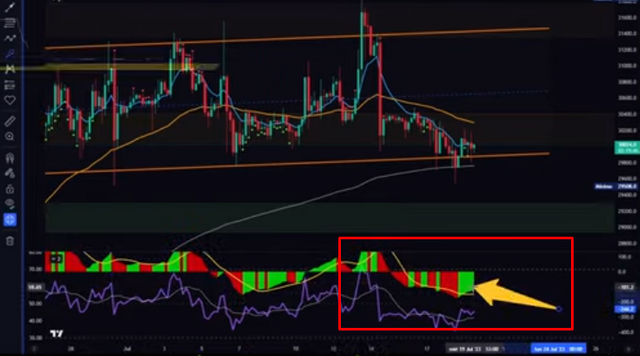
2-) A downward trend is observed on the daily charts, but there is no clear trend yet.
Technical setups and bullish outlook
1-) The squeeze is reaching line 0, which indicates a high probability of a sharp upward movement.
2-) The Magdi indicator shows a buy setup with the yellow line above it.
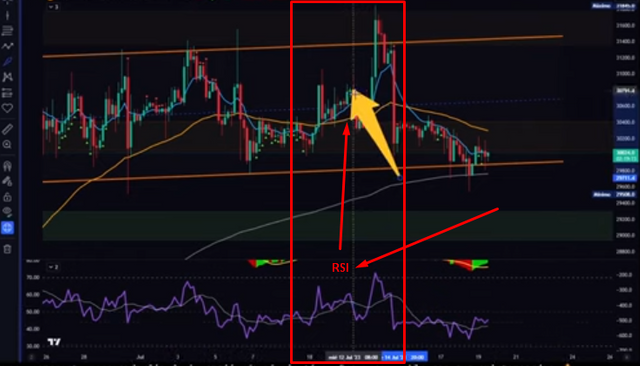
3-) If the RSI crosses the 50 level to the upside, a strong upward movement is expected.
bullish outlook
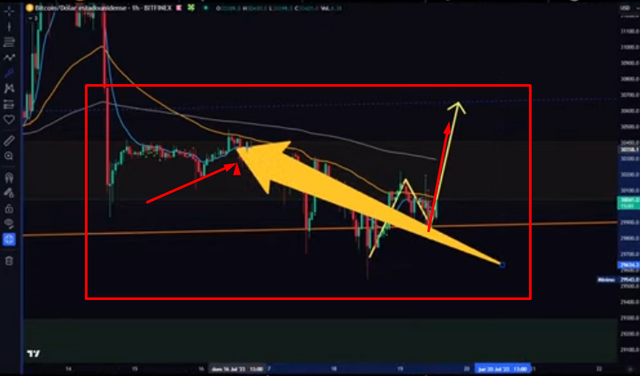
1-) The combination of the technical configurations and the location of the price in the ascending channel suggest a possible upward movement.
2-) A 4-hour candle close above the 10-period moving average would be a catalyst for a bullish move.
Price analysis on daily charts
Price action on the daily charts is analyzed and a downtrend is identified.
Price action on daily charts
1-) A lower minimum is observed than the previous one, but it is not possible to make a higher maximum than the previous one.
2-) There is a clear downward trend structure in this small period of time.
General analysis
1-) A general analysis of the Bitcoin price is carried out and it is concluded that there is no clear trend at the moment.
2-) The analysis focuses on a specific segment of the chart and does not represent a long-term trend.
3-) There is not enough evidence to determine if the price has a bullish or bearish trend.
Analysis of the bearish structure
In this section, we look at the bearish price structure and how it has supported the bottom of the rising channel. It is mentioned that the price is making a higher low than the previous low, which breaks the bearish structure. A possible breakout is expected if a candle closes above the previous high.
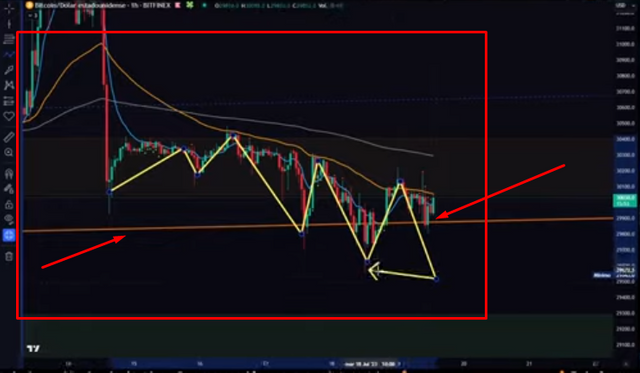
1-) The price has supported the bottom of the ascending channel.
2-) A higher low is forming than the previous low.
3-) This breaks the bearish structure.
4-) A possible upward breakout is expected if a candle closes above the previous high.
Evening/early morning forecast
In this section, a forecast for the night/early morning is given based on the previous analysis. If no significant change occurs, it is likely that the test will still be valid the next morning.
1-) The forecast for the night/early morning is based on the previous analysis.
2-) If no significant changes occur, it is likely that the analysis will still be valid the next morning.
Vote @bangla.witness as lead witness please

Image designed in Canva (Canva.com) |
|---|
Let us remember commenting and voting for help does not cost any God bless you.
This article was written by @oscardavid79 free of copyright
Thank you, friend!


I'm @steem.history, who is steem witness.
Thank you for witnessvoting for me.
please click it!
(Go to https://steemit.com/~witnesses and type fbslo at the bottom of the page)
The weight is reduced because of the lack of Voting Power. If you vote for me as a witness, you can get my little vote.
Twitter
https://twitter.com/oscardavidd79/status/1681917987572285441
Upvoted! Thank you for supporting witness @jswit.
Please I want to understand, did you create those images from canvas?
Those Images looks like a screenshot from trading view, how is it that you said they are made from canvas
corrected thank you very much for the correction
Honestly, I see BTC movement is boring and tends to be sideways.
but this indicates an accumulation of strong upward or downward tendencies.
but in my view BTC might be corrected to take the demand area. moreover the sideways area is now at the weekly resistance level.