Top Down Analysis Of ETHUSDT Using Support And Resistance Strategy And RSI Indicator As Confluence

Hello great minds,
It is a great opportunity to come before you all today to share my technical analysis on eth against usdt.
I believe you are all doing perfectly well and are enjoying your activities in the community as you actively promote steemit across various social media platform.
Ethereum is a very big cryptocurrency in the cryptospace and we are well aware of this.
Ethereum happens to be the second most biggest and popular cryptocurrency in the cryptospace.
After Bitcoin which is the driver of all other tokens, ethereum is known to be the next most valuable token, and I am here to share my analysis to it.
ANALYSIS USING SUPPORT AND RESISTANCE STRATEGY
I begin my technical analysis from the higher timeframe, then I descend to the lower timeframe
On the higher timeframe, ideally the monthly timeframe, I seek to determine market trend
The monthly timeframe helps to eliminate market noise from the market and also compress the market to one screen.
And from this, it becomes very easy for the market trend to be predicted.
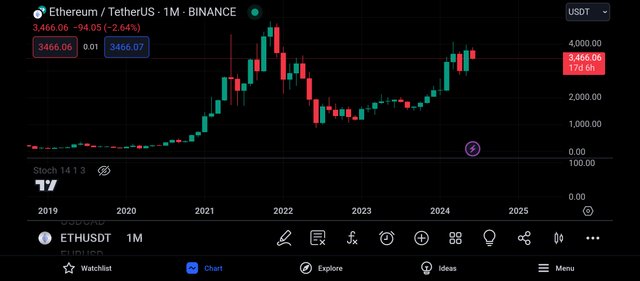
The screenshot above is that of the pair ethusdt on the monthly timeframe.
And as seen above, there are lesser candles on this timeframe and this is as a result of the time it takes for one of this candles to be formed.
On the monthly timeframe, it takes the time period of 1month for each candle to be formed.
And also, it is easy for the overall trend of the market to be detected on this timeframe, as we can see that the market is being bullish.
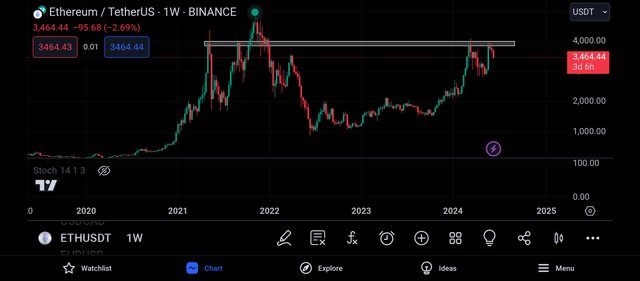
I then continued my analysis on the weekly timeframe, and on this I could see more market activities.
On this timeframe, each candle is being formed within the trading period of 7days, and like I said, there are more candlestick on this timeframe than on the monthly timeframe.
And on this timeframe, I was able to spot out a key level and this level is functioning as a resistance level to the price chart.
And on this level, there are more sellers than buyers and as such the market is expected to experience a bearish move.
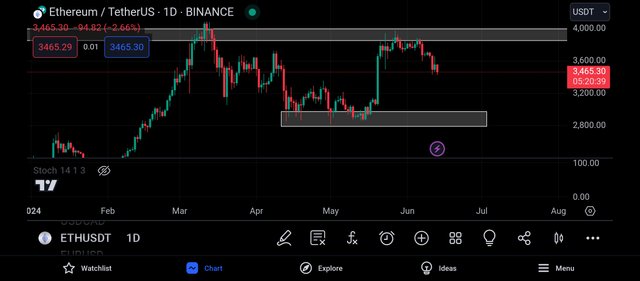
I then continued my analysis by going to the daily timeframe, and on this timeframe, I could feel the presence of buyers and sellers in the market.
And I noticed that the market has already been rejected from the resistance level spotted on the weekly timeframe, as we can see series of bearish candles.
And looking carefully, i was able to spot another level and this level is functioning as a support level to the market.
And on this level, there are more buyers than sellers and as such we expect to see a bullish rejection candle when the market trades towards this level.
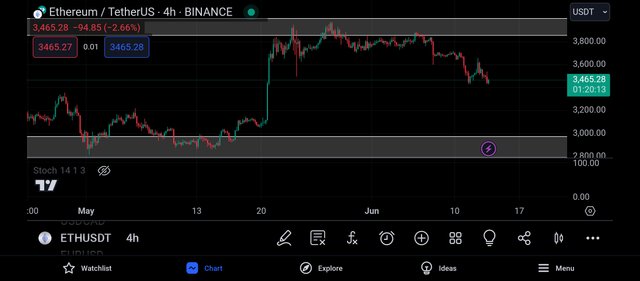
Getting to the 4hr timeframe, I could see the market movement more clearly.
I could clearly see the struggle between buyers and sellers as they manipulate the market to their preferred direction.
And from the above screenshot, we can say that the sellers are taking control of the market as we can see the formation of series of bearish candles.
Then I decided to continue my analysis on the 2hr timeframe, as it is on this timeframe that I search for entry into the market.
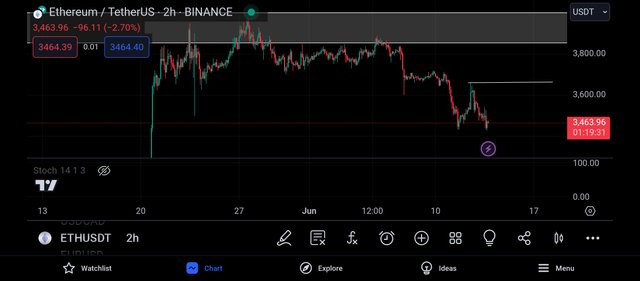
Getting to the 2hr timeframe, I could see lots of market noise and I already have my bias of the market despite the noise.
And looking carefully, I was able to detect a level which I expect the market to trade towards before continuing it's bearish trend.
With my bias, I decided to search for confluence using the relative strength index indicator.
CONFLUENCE USING RELATIVE STRENGTH INDEX INDICATOR
The relative strength index indicator is an indicator that helps to identify overbought and oversold market.
When a market is spotted to be overbought, it is a bearish trend reversal signal and when it is oversold, it is a bullish trend reversal signal.
An overbought market can be spotted when the rsi crosses above the 80% line and an oversold market is detected when the market crosses below the 20% line.
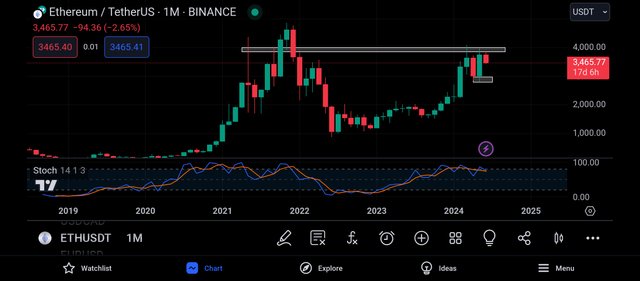
By applying the rsi indicator on the monthly timeframe, I noticed that the rsi has crossed above its 80% line.
And this is an indication that the market is being overbought and an overbought market is one that signals a bearish trend reversal.
It is a market that shows change in market power from the bulls to the bears.
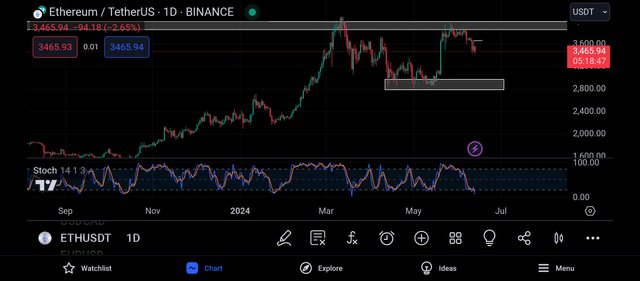
I then decided to apply the rsi on the daily timeframe next, and on this timeframe, we can see that the market has crossed below the 20% line, and this is an indication that the market is being oversold.
And an oversold market is the opposite of an overbought market, as it signals change in market strength from the sellers to the buyers.
Then I moved to the 2hr timeframe as it is on this timeframe that I search for my entry into the market.
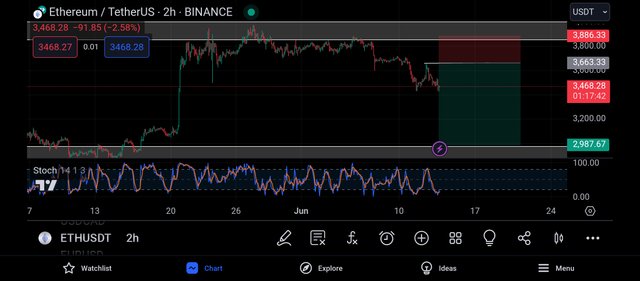
Recall that I earlier said that my bias of the market is bearish, but I needed to find a suitable entry position.
And on this timeframe, I was able to spot a key level which I could use as an entry, but I'll wait for the market to retrace upward to take me in on the market.
And from the above screenshot, we can see that I have placed my entry on this level and my take profit on the closest support level to the market.
CONCLUSION
I have shared my analysis on ethusdt beginning from the monthly to the weekly to the daily and to the hourly.
From my analysis, I expect to see a bearish move on ethusdt.
https://x.com/JuecoYoung/status/1801358707986411765
Upvoted! Thank you for supporting witness @jswit.