Top Down Analysis Of ETHUSDT Using Support And Resistance Strategy And RSI Indicator As Confluence

Hello great minds,
It is a great opportunity to come before you all today to share my technical analysis on eth against usdt.
I believe you are all doing perfectly well and are enjoying your activities in the community as you actively promote steemit across various social media platform.
Ethereum is a very big cryptocurrency in the cryptospace and we are well aware of this.
Ethereum happens to be the second most biggest and popular cryptocurrency in the cryptospace.
After Bitcoin which is the driver of all other tokens, ethereum is known to be the next most valuable token, and I am here to share my analysis to it.
ANALYSIS USING SUPPORT AND RESISTANCE STRATEGY
I begin my technical analysis from the higher timeframe, then I descend to the lower timeframe
On the higher timeframe, ideally the monthly timeframe, I seek to determine market trend
The monthly timeframe helps to eliminate market noise from the market and also compress the market to one screen.
And from this, it becomes very easy for the market trend to be predicted.
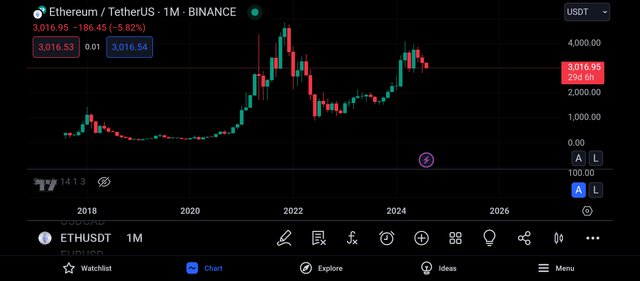
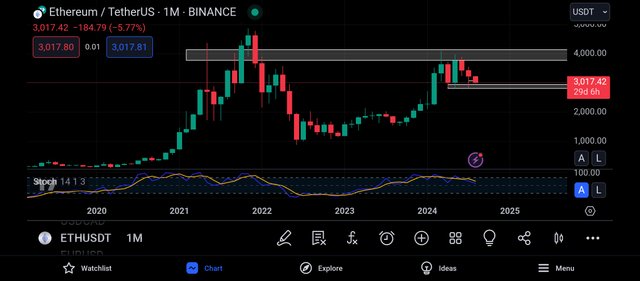
The screenshot above is that of the pair ethusdt on the monthly timeframe.
And as seen above, there are lesser candles on this timeframe and this is as a result of the time it takes for one of this candles to be formed.
On the monthly timeframe, it takes the time period of 1month for each candle to be formed.
And also, it is easy for the overall trend of the market to be detected on this timeframe, as we can see that the market is being bullish.
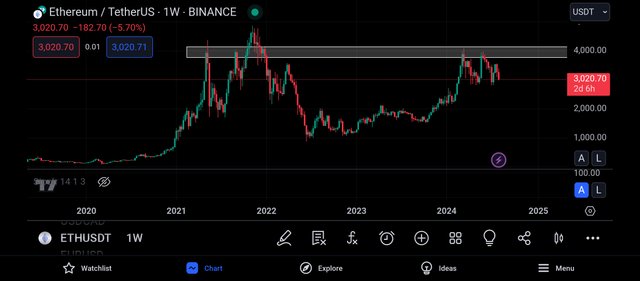
I then continued my analysis by moving to the weekly timeframe, and on this timeframe, I noticed that there are more candlestick here than on the monthly timeframe.
And looking carefully, I was able to spot a key level and this level is functioning as a resistance level to the market price, as it is expected for the market to be rejected when it trades towards this level.
And looking carefully, I noticed that the market has made several touches on this level and has been unable to break above, and as such, this level can be said to be a valid resistance level.
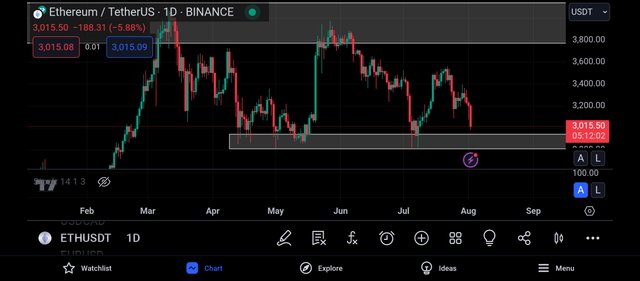
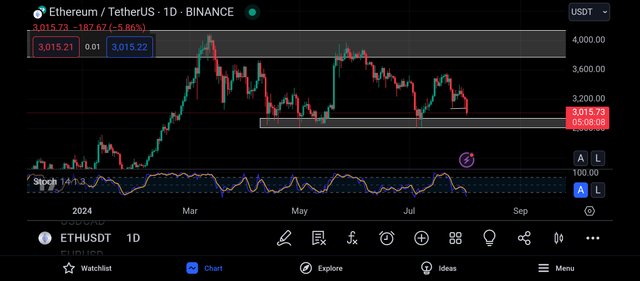
And getting to the daily timeframe, I could see the market more clearly, I could feel the presence of buyers and sellers in the market.
And looking carefully, I was able to spot a key level and this level is functioning as a support level to the market, and on this level, I can see that the market has made several touches on this level and has been unable to break below.
And as such, it is expected for the market to be rejected when it trades towards this level, as the buying pressure on this level becomes higher than the selling pressure.
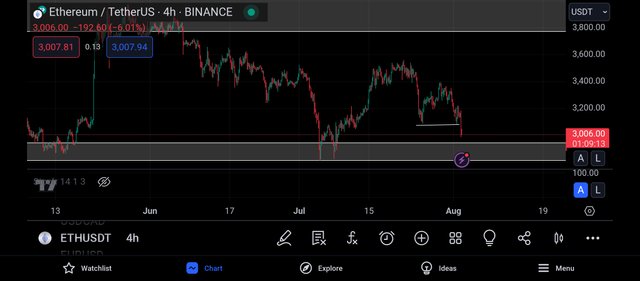
I then proceeded to the 4hr timeframe, and on this timeframe, I zoomed out so as to see the market more clearly.
I noticed that the market is forming series of lower lows and lower highs, showing that it is in a bearish retracement phase.
And looking carefully, I was able to spot a structure that was broken by the market, and the break of this structure confirms the continuous bearish move of the market.
And looking carefully, I noticed that the market is about to test this level, and when it does, I expect to see a bullish move on the market.
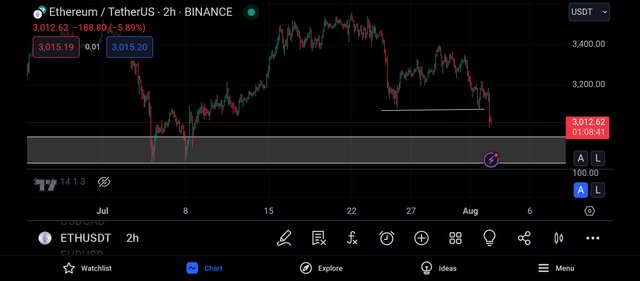
And getting to the 2hr timeframe, I could see the market more clearly, and I could see how the market is approaching this support level.
However, my bias of the market is being bullish and before entering a buy on the market, I decided to search for confluence using the rsi indicator.
CONFLUENCE USING RELATIVE STRENGTH INDEX INDICATOR
The relative strength index indicator is an indicator that helps to identify overbought and oversold market.
When a market is spotted to be overbought, it is a bearish trend reversal signal and when it is oversold, it is a bullish trend reversal signal.
An overbought market can be spotted when the rsi crosses above the 80% line and an oversold market is detected when the market crosses below the 20% line.
I then continued my analysis by moving to the monthly timeframe, and on the monthly timeframe, I noticed that the market has gotten to its 80% line, and this is an indication that the market is being overbought.
An overbought market is one that signals a bearish trend reversal of the market, that is, a change in market for from the buyers to the sellers.
And as such, I decided to continue my analysis on the daily timeframe.
On the daily timeframe, I noticed that the rsi has crossed below its 20% line, and this is an indication that the market is being oversold.
And an oversold market is one that signals a bullish trend reversal of the market, it shows the weakness of the bears and the strength of the bulls in the market.
I then decided to move to the 2hr timeframe in search of entry into the market
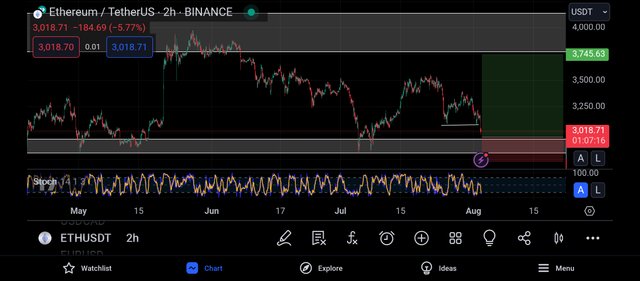
With my bullish bias of the market, I immediately placed my entry on the closest support level on the market, and my take profit was placed on the closest resistance level on the market, and this cab be confirmed from the screenshot above.
CONCLUSION
I have shared my analysis on ethusdt beginning from the monthly to the weekly to the daily and to the hourly.
From my analysis, I expect to see a bullish move on ethusdt.
https://x.com/JuecoYoung/status/1819475894399799301
Upvoted! Thank you for supporting witness @jswit.