Topdown Analysis Of DYDXUSDT Using Support And Resistance Strategy And RSI Indicator As A Confluence
Hello great minds,
I feel excited to come before you all this evening to relate with you on another interesting post in the community.
I trust you are all doing perfectly fine and are enjoying your activities in the community as you actively promote steemit across various social media platform.
Today I will be sharing my analysis on dydxusdt just as I used to in the community, please stay tuned.
ANALYSIS USING SUPPORT AND RESISTANCE STRATEGY
Dydx is a good token in the cryptospace which is one reason I have chosen it for my analysis today.
And I will be sharing the latest price movement as at when this post was made.
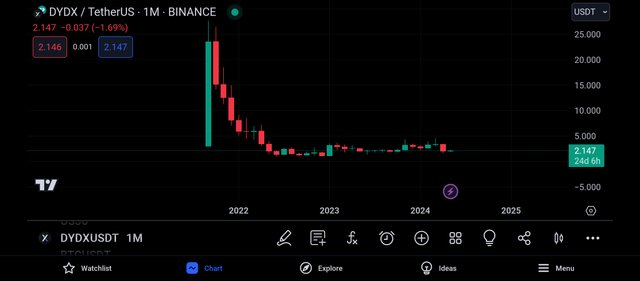
I decided to begin my analysis on the monthly timeframe just as seen above.
And on this timeframe, we can see that there are less candles on the price chart, which indicates the presence of buyers and sellers in the market.
And also, the monthly timeframe helps to filter out noise from the market as each candle is formed within the time period of 1month.
Also on this timeframe, it is very easy for the market overall trend to be detected, and from the screenshot above, we can see that the market is being bearish overall.
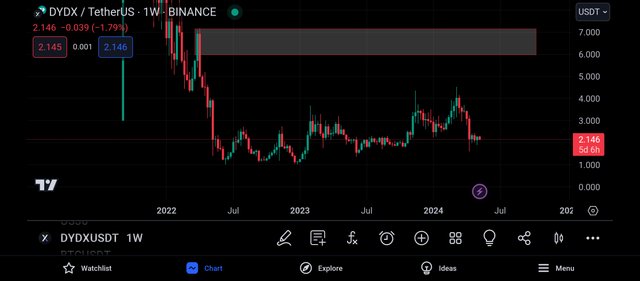
Then I continued my analysis by moving to the weekly timeframe, and on this timeframe I could see more market activities than on the monthly timeframe.
Each candle on this timeframe was formed within the space of 1week, and on this timeframe, I could see the buyers and sellers struggle to Push price to their preferred direction.
On this timeframe, I was able to spot a key level which is functioning as a resistance level to the market price.
And this level is expected to price when the market gets to it.
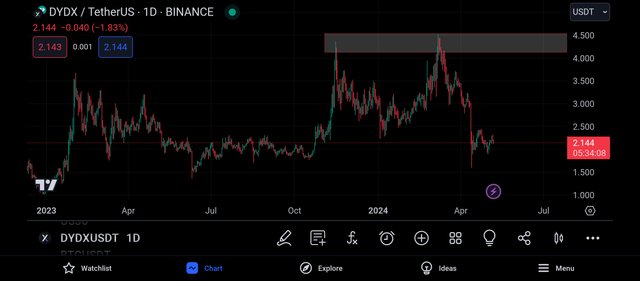
I then move to the daily timeframe for more market analysis.
On this timeframe I could see more noise in the market as each candle is formed within the space of 1day.
Looking carefully at the market, I was able to spot another key level which is functioning as a resistance level.
And from the above screenshot, we can see that the market has recently been rejected from this level, and as such I continued my analysis by going to a lower timeframe.
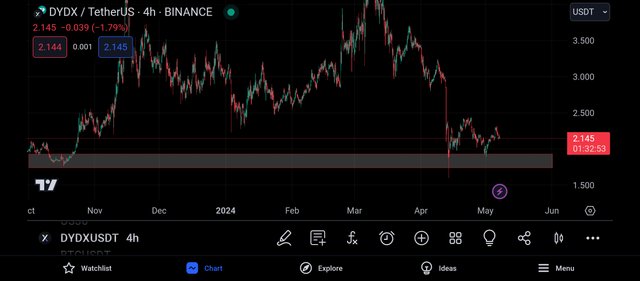
Moving to the 4hr timeframe, I saw more market noise which was caused by market manipulation and other major activities.
Then I was able to spot a key level which will be functioning as my support level.
And it is expected that whenever the market trades to this level, it should respect this level and in most cases be rejected by this level.
And from the above screenshot, we can see that this level has been respected severally by the market.
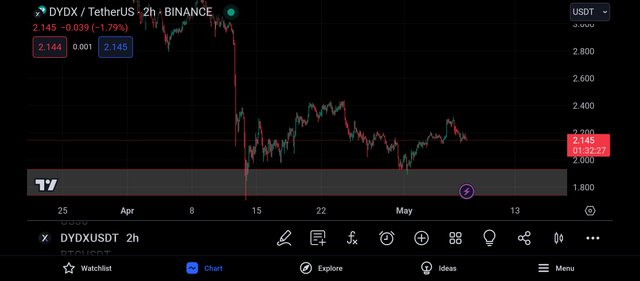
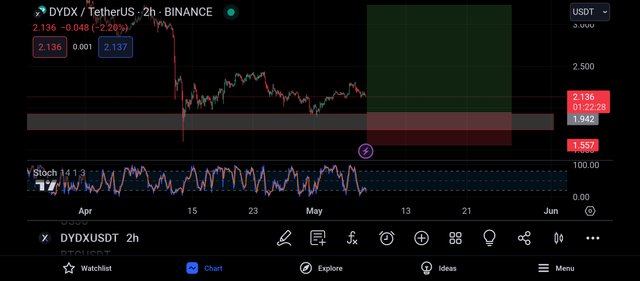
I then decided to continue my analysis on the 2hr timeframe, as it is on this timeframe that I search for my entry into the market.
On this timeframe, I could see the market movement more clearly and I could see that the support level is a valid one and will hold the market, with this, my bullish bias was made and I decided to search for confluence using rsi indicator before entering the trade.
CONFLUENCE USING RELATIVE STRENGTH INDEX INDICATOR
The rsi Indicator is a very important trading tool in the cryptomarket.
The rsi indicator is used to spot oversold and overbought market regions.
And when a market is spotted to be oversold, it is a signal that the market is about to experience a bullish move.
And when a market is spotted to be overbought, it is a signal that the market is about to experience a bearish move.
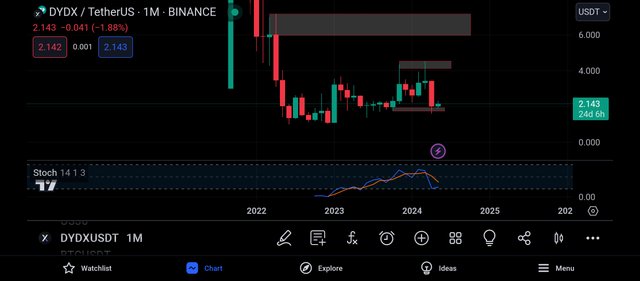
Beginning with the monthly timeframe as usual, I could see that the rsi indicator has gotten to its 20% line, and this is an indication that the market is being oversold.
An oversold market is often known for its bullish trend reversal signals, this implies that we expect to see a bullish move of the market.
Then I decided to continue my analysis using rsi indicator on the daily timeframe
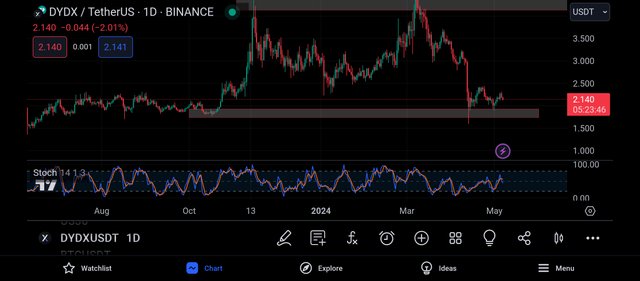
Moving to the daily timeframe, I noticed that the rsi is approaching its 80% line, which is an indication that the market is about to be overbought.
When it gets to its 80% line, we can say that the market is being overbought and this can be interpreted as a bearish trend reversal signal.
And with this, I continued my analysis on the 2hr timeframe.
Getting to the 2hr timeframe, I noticed from the rsi indicator that the market is being oversold.
And an oversold market is signalling a bullish trend reversal, and this is in alliance with my analysis using support and resistance strategy.
And as such, I decided to place a buy order on the closest support level to the market price and my take profit was placed on the closest resistance level.
CONCLUSION
Dydx is actually a very good token but before investing in it, I'll advise that you make your personal research about it.
My post was made for educational purpose and not as a financial advice.
Upvoted! Thank you for supporting witness @jswit.
https://twitter.com/JuecoYoung/status/1787951815247470956