Topdown Analysis Of LINKUSDT Using Support And Resistance Strategy And RSI Indicator As A Confluence

Hello great minds,
It is a wonderful opportunity to come before you all today to share my analysis on link against usdt.
I trust you are all doing perfectly fine and are enjoying your activities in the community as you actively promote steemit across various social media platform.
LINK is a very nice token in the cryptospace and today, I am here to share my live analysis on its price movement.
ANALYSIS USING SUPPORT AND RESISTANCE STRATEGY
My analysis of the cryptomarket, irrespective of the token I am analysing begins from the monthly timeframe down to the 2hr timeframe, where I then seek for an entry into the market.
On the monthly timeframe, I tend to search for the overall market trend, that is the trend of the market on a larger scale.
The monthly timeframe helps to compress market movement and also eliminate unnecessary distraction from the market, it reduces the noise from the lower timeframe.
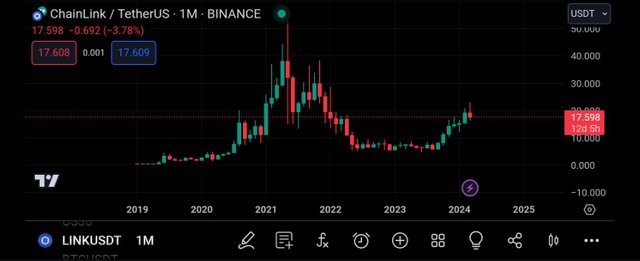
As shown above is the price chart of LINKUSDT on the monthly timeframe.
And from the screenshot above, we can see that the market is in a bearish trend, forming lower lows and lower highs.
And when we look carefully, we will notice that the latest market leg is being bullish, constituting of bullish candles.
And to understand market movement better, I decided to move to the weekly timeframe to mark out key market levels.
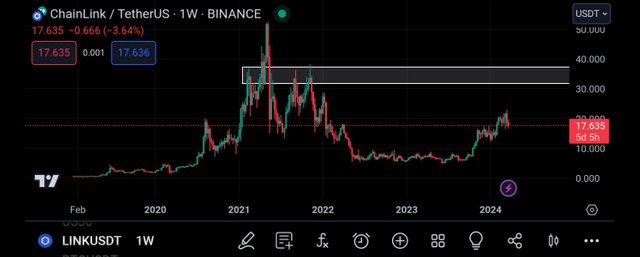
Switching to the weekly timeframe, I was able to see the market movement more clearly.
I can see more market activities which is expected and I was able to spot a key resistance level on the market.
This level can be considered to be a valid level because it has been severally tested and respected by market price.
And it is expected that when the market gets to this level, it will be rejected to the downside, and then i can take my entry.
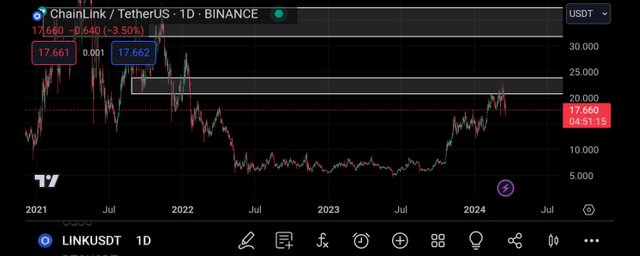
Moving to the daily timeframe, I can see more market activities.
And on this timeframe, I was able to spot another resistance level on the price chart, and this level can be said to be a valid level because it has been severally tested and respected by market price.
I then noticed that the market has gotten to this level and has been rejected by the level.
Then I decided to move to the 4hr timeframe for more analysis before searching for an entry into the market.
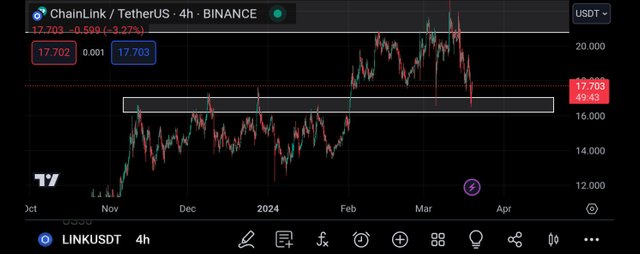
Getting to the 4hr timeframe, I could see more market noise.
Then I looked carefully and was able to detect a support level on the price chart.
This level has functioned previously as an effective resistance level to the market price before it got broken.
Now it is functioning as a support level to the market price, and as seen above, the market is about to be rejected to the upside.
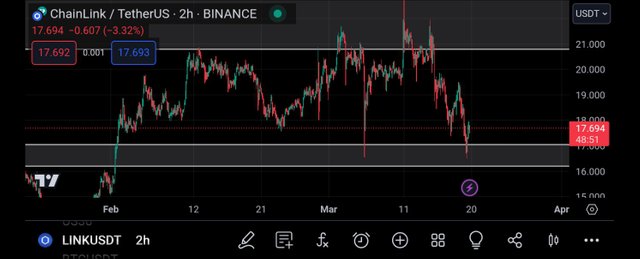
Moving to the 2hr timeframe, I could see the market activities more clearly.
And on this timeframe, I can see a rejection candle and this is the confluence I need to enter the trade.
And before entering my buy order, I decided to make use of the relative strength index indicator for confluence
CONFLUENCE USING RELATIVE STRENGTH INDEX INDICATOR
The relative strength index indicator is an indicator that helps to identify overbought and oversold market.
When a market is spotted to be overbought, it is a bearish trend reversal signal and when it is oversold, it is a bullish trend reversal signal.
An overbought market can be spotted when the rsi crosses above the 80% line and an oversold market is detected when the market crosses below the 20% line.
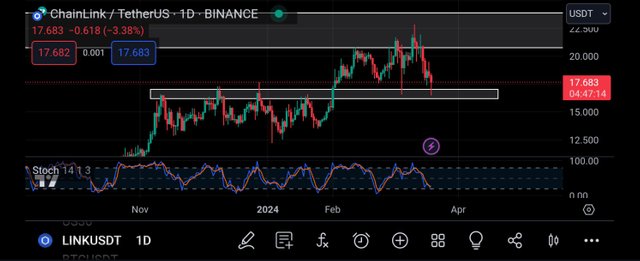
I began my analysis from the daily timeframe, and from the screenshot above, we can see that the rsi has approached the 20% line.
And this can be said to be an oversold market, and it is a signal for bullish trend reversal.
And this signal is in alliance with my support and resistance strategy.
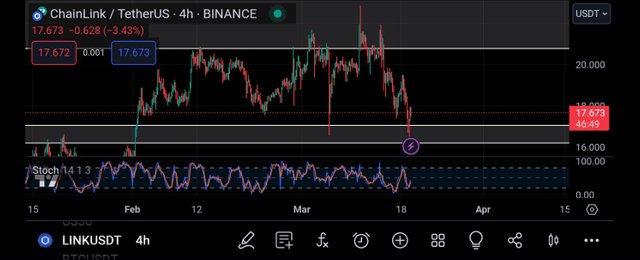
Then I moved to the 4hr timeframe for more confluence.
On this timeframe, I also noticed that the market is being oversold, and an oversold market signals a bullish trend reversal move.
And this is in alliance with my analysis using support and resistance strategy.
Then I moved to the 2hr timeframe to search for my entry into the market.
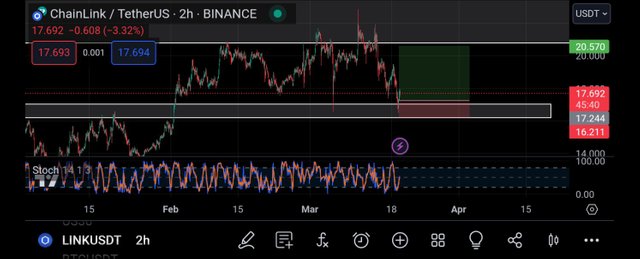
Then moving to the 2hr timeframe, I decided to place my entry on the support level, and I placed my take profit in a way that I got a R:R of 1:3.
And this can be confirmed from my screenshot above.
CONCLUSION
Chain link is a very important crypto project in the cryptoecosystem and I have shared my analysis on this project.
As we continue our journey, we will learn more about many other crypto project.
https://twitter.com/JuecoYoung/status/1770201852484714762
Upvoted! Thank you for supporting witness @jswit.