Topdown Analysis Of SOLUSDT Using Support And Resistance Strategy And RSI Indicator As A Confluence
Hello great minds,
It is a wonderful opportunity to come before you all today to discuss on an issue of great importance in the cryptospace.
I believe you are doing perfectly fine and are enjoying your activities in the community as you actively promote steemit across various social media platform.
Today, I will be sharing my analysis on solusdt, and Solana is a popular token in the cryptospace.
Solana is a very popular project in the cryptospace and has brilliant team who are diligent and have great fundamentals, and as such, I will be sharing my analysis.
Please stay tuned and check out my analysis on this great token.
ANALYSIS USING SUPPORT AND RESISTANCE STRATEGY
My analysis of the cryptomarket often begins from the higher timeframe to the lower timeframe, but I prefer beginning mine from the monthly timeframe.
The monthly timeframe helps me a lot in filtering out noise from the market, and alongside that, it also plays a huge role in the identification of market trends.
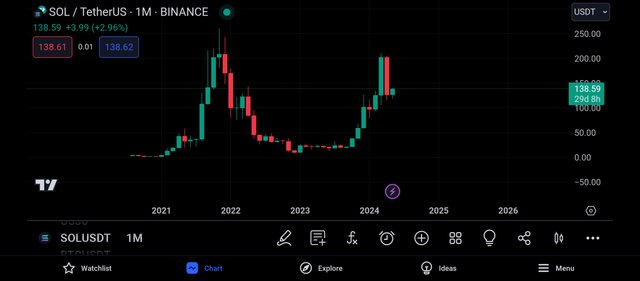
Begining with the monthly timeframe of the pair solusdt, we can see that there are bullish and bearish candles present in the market.
And we can also see that there are lesser candles on this timeframe, and this is because each candle is formed within the space of 1month.
Also on this timeframe, it is easier for the overall market trend to be detected, and we can see that the market is being bullish on its most recent legs.
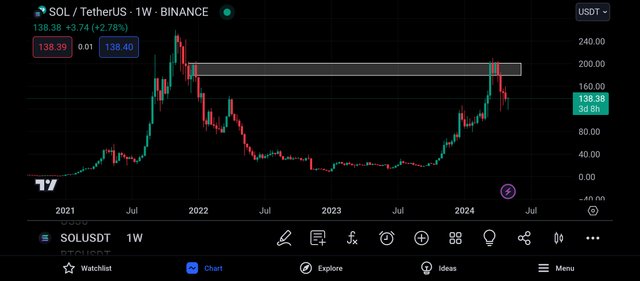
Then I continued my analysis to the weekly timeframe, and on this timeframe I could see more market activities than on the monthly timeframe.
Then looking carefully, I was able to spot a key level on this timeframe, and this level is to function as a resistance level to the price chart.
And from the above screenshot, we can see that the market has been rejected by this level, with the formation of several bearish candles.
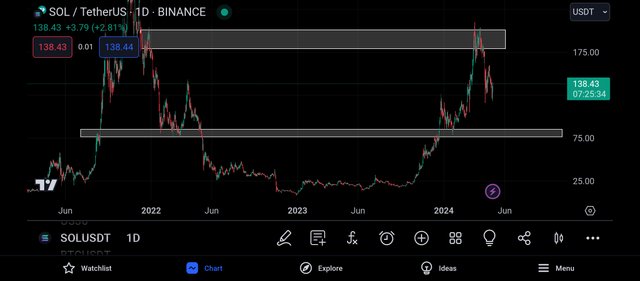
Then I continued my analysis by going to the daily timeframe, and on this timeframe, I could see noise in the market.
Then watching carefully I was able to spot another key level.
This level is functioning as a support level to the price chart, and this level is believed to be a valid level because it has previously been respected by the market.
And it is expected that when the market gets to this level, it gets rejected to the upside with the formation of several bullish candles.
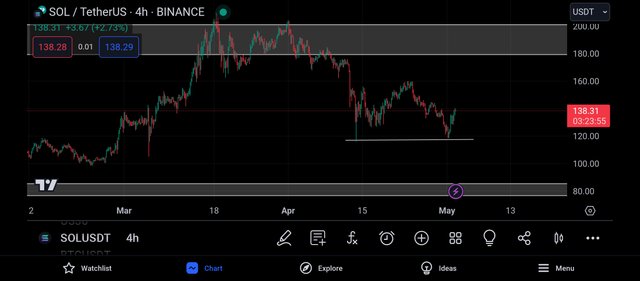
Continuing my analysis on the 4hr timeframe, I could see so much noise in the market, as the buyers and sellers tend to drive market price to their preferred direction.
Also on this timeframe I was able to spot a key level in form of market wick, and as seen above, the market has reacted off this level just as expected.
It is from this reaction that I intend to take my entry into the market, and to do this, I moved to the 2hr timeframe.
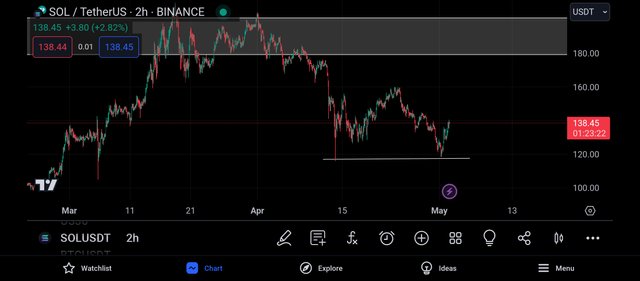
On the 2hr timeframe, there are lots of noise in the market.
And from this, I expect to see a bullish move on the price chart, but before entering the market, I decided to search for confluence using rsi indicator.
CONFLUENCE USING RELATIVE STRENGTH INDEX INDICATOR
The rsi indicator is a technical tool that is used to detect overbought and oversold market.
When the rsi oscillator crosses above the 80% line, the market is said to be overbought and this is known to be a bearish trend reversal signal.
And when the rsi oscilator crosses below the 20% level, the market is said to be oversold.
An oversold market signifies a bullish trend reversal signal, that is , the market is expected to move in the upside direction.
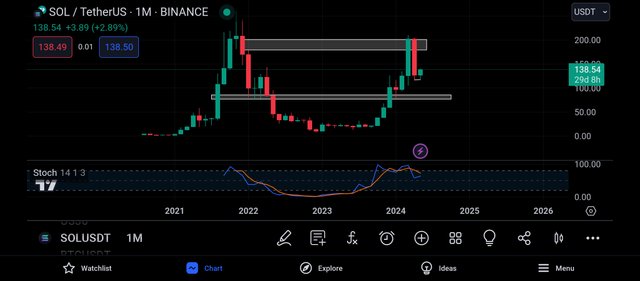
Beginning with the monthly timeframe, I noticed that the rsi indicator has crossed it's 80% line.
And this is an indication that the market is being overbought, and an overbought market is expected to be sold.
In other words, an overbought market is one that signals a bearish trend reversal, and then I decided to continue the analysis from the daily timeframe.
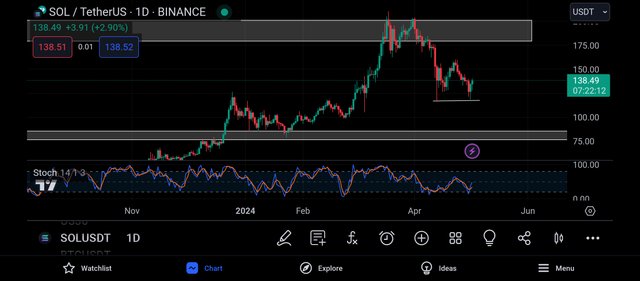
Moving to the daily timeframe, I noticed that the market is being oversold, as the rsi has crossed below its 20% line.
And an oversold market needs to be bought, and this implies that the market is expected to experience a bullish trend move.
And this is in alliance with my analysis using support and resistance strategy.
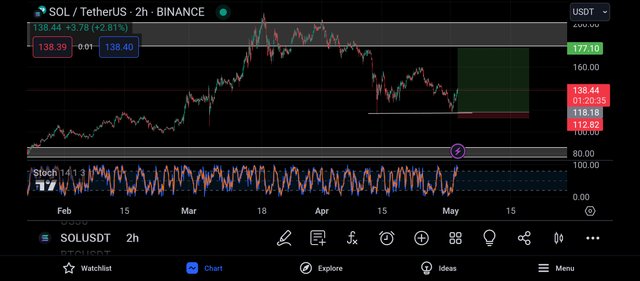
I then moved to the 2hr timeframe in search of entry into the market.
And looking at the rsi, we expect to see a bearish momentary move of the market, and as such I placed my buy order on the closest resistance level to the market price.
And my take profit was placed on the closest support to the market, just as seen above.
CONCLUSION
Solana is a very good project in the cryptospace but I encourage all to make their own research before investing in any token.
My post should not be taken as a financial advise rather as an educational content.
Upvoted! Thank you for supporting witness @jswit.
https://x.com/JuecoYoung/status/1786128203485962269
I think you did a solid job identifying key levels that have shown some degree of respect from the market. The RSI confluence is an interesting addition, though I would urge some caution there. While the overbought/oversold signals can indeed foreshadow reversals, they don't necessarily provide precise entry/exit points by themselves. Factors like timeframe and previous price action context play a big role, as I'm sure you know.