Topdown Analysis Of BTCUSDT Using Support And Resistance Strategy And RSI Indicator As A Confluence
Hello great minds,
It is a great opportunity to appear before you all today to share my analysis on bitcoin.
I believe you are all doing perfectly fine and are enjoying your activities in the community as you actively share in steemit promotion across various social media platform.
Bitcoin as we know it, is the father of all other cryptocurrency and it is worth carrying an analysis on, since it is the driver of all other cryptocurrency in the cryptospace.
Today, I will sharing my analysis of btcusdt and I will be beginning from the monthly timeframe.
ANALYSIS USING SUPPORT AND RESISTANCE STRATEGY
My analysis often begin from the higher timeframe and it moves to the lower timeframe.
On the higher timeframe like the monthly timeframe, I identify market trends, and on other timeframe I search for key market levels and also search for entries into the market.
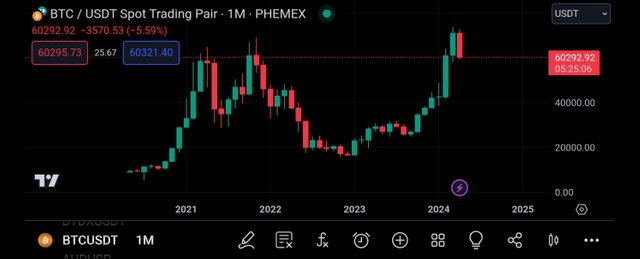
The above screenshot is that of btcusdt on the monthly timeframe as we can all confirm.
And from the above screenshot, we can see that there are less candles on this timeframe, and this is because each candle formed on this timeframe takes an activity period of one month.
Also on this timeframe, we can notice that the market trend is easily identified, and from the screenshot above, we can see that Bitcoin market is bullish overall.
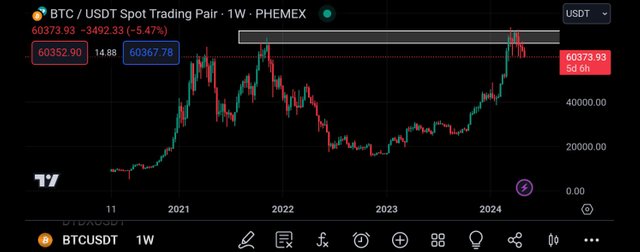
I then continued my analysis moving to the weekly timeframe, and on this timeframe, I can see that there are more candlestick on this timeframe than on the monthly timeframe.
And also on this timeframe, I was able to spot a key level on the market, and this level will be functioning as a resistance level to the price chart.
And as seen above, this level has began rejecting the market price which is expected.
And it is from this rejection that we can search for an entry into the market.
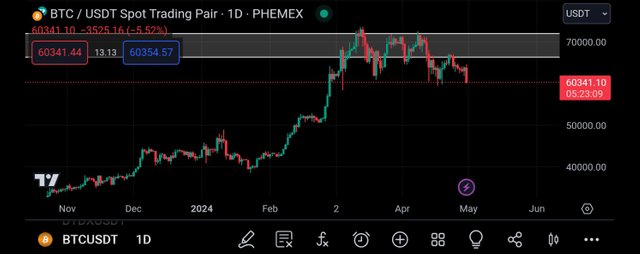
Then I moved to the daily timeframe inorder to continue my analysis.
And on this timeframe, I could see more market activities, I could see the sellers striving to pull the market price downward.
And also, I can see the presence of bears in the market as the market contains more bearish candles.
Then I decided to move to the 4hr timeframe for more market analysis before I search for my entry into the market.
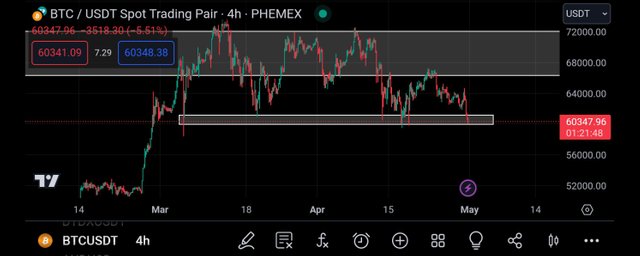
Getting to the 4hr timeframe, I could see more market activities, I could see noise in the market, and here, both buyers and sellers strive to push price to their preferred direction.
I then spotted another key level on this timeframe, and this level will be functioning as a support level to the market price.
This level has been severally respected by market price, and it is expected for history to be repeated when the market gets to this level.
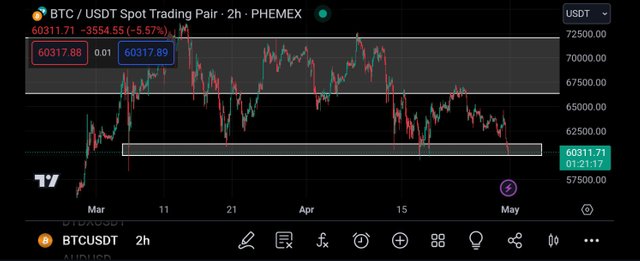
On the 2hr timeframe, I can see that the market has gotten to this support level, and also I can see that there are several candlestick on this timeframe.
And on the support level, I can see bullish rejection candle, and this further strengthened my bias that the market is going to experience an upward movement.
Then I decided to apply the rsi indicator to the price chart for it to serve as a confluence to my analysis.
CONFLUENCE USING RELATIVE STRENGTH INDEX INDICATOR
The relative strength index indicator is an indicator that helps to identify overbought and oversold market.
When a market is spotted to be overbought, it is a bearish trend reversal signal and when it is oversold, it is a bullish trend reversal signal.
An overbought market can be spotted when the rsi crosses above the 80% line and an oversold market is detected when the market crosses below the 20% line.
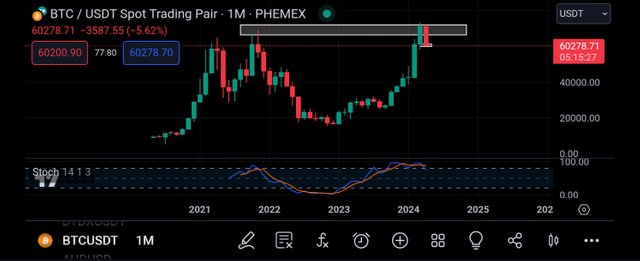
I then decided to add the rsi indicator to the monthly timeframe.
When added, I noticed that the market is being overbought, and this is so because I noticed that the rsi has crossed above its 80% line.
An overbought region indicates that the market is about to experience a bearish trend reversal, then I decided to move to the daily timeframe for more confluence.
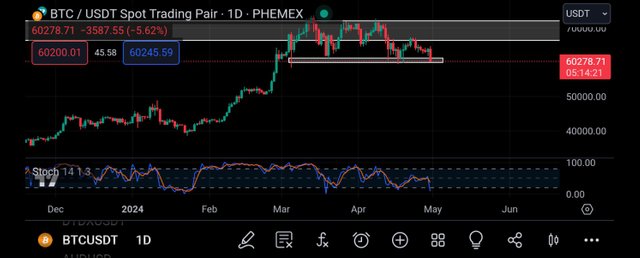
Moving to the daily timeframe, I noticed that the rsi has crossed below it's 20% line, and this is an indication that the market is being oversold.
An oversold market is one that is expected to be bought, that is, it is expected to experience a bullish trend reversal.
And this is in alliance with my analysis using support and resistance strategy.
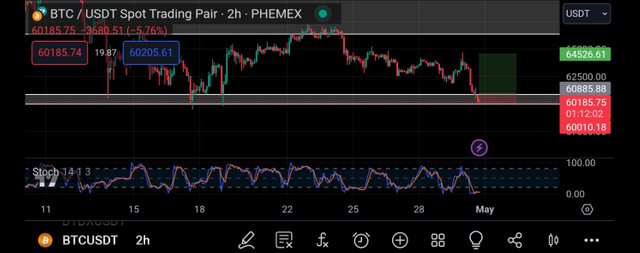
I then continued with the 2hr timeframe, as it is on this timeframe that I search for my entry
On this timeframe, I noticed that the market is being oversold also, and this is a bullish trend reversal signal.
And with this, I placed a buy order, and my entry was placed on the closest support level and my take profit was placed on the closest resistance level, just as seen above.
CONCLUSION
Bitcoin is the father of all cryptocurrency and it is the driver of all other altcoins in the cryptomarket.
I have shared my analysis on the market and I expect to see a momentary bullish move.
Upvoted! Thank you for supporting witness @jswit.
https://twitter.com/JuecoYoung/status/1785407726899605594