Topdown Analysis Of AVAXUSDT Using Support And Resistance Strategy And RSI Indicator As Confluence
Hello great minds,
I feel honored to approach you all today to discuss on a very important issue in the cryptospace.
I believe you are all doing perfectly fine and are enjoying your activities in the community as you actively promote steemit across various social media platform.
Today I will be sharing my analysis on the token of avalanche network which is avax, and I will be sharing my analysis on avax against usdt.
Please stay tuned as I share my analysis
ANALYSIS USING SUPPORT AND RESISTANCE STRATEGY
Technical analysis are best started from the higher timeframe and then to the lower timeframe.
Some analyst prefer starting their analysis from the daily timeframe, down to the fewer minutes, but I begin mine from the monthly timeframe.
The monthly timeframe helps me to compress market activities and display them on a screen.
And the monthly timeframe also helps in eliminating unnecessary noise from the market.
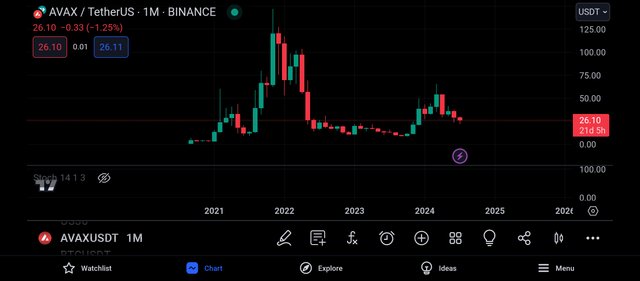
Beginning with the monthly timeframe of the pair AVAXUSDT, we can see the formation of bullish and bearish candles.
We can also see that there are few candles on this timeframe and this is because each candlestick were formed within the space of 1month.
Also from the above screenshot, we can notice that it is easier for the market trend to be identified, and from the above screenshot we see that the most recent leg of the market is bullish.
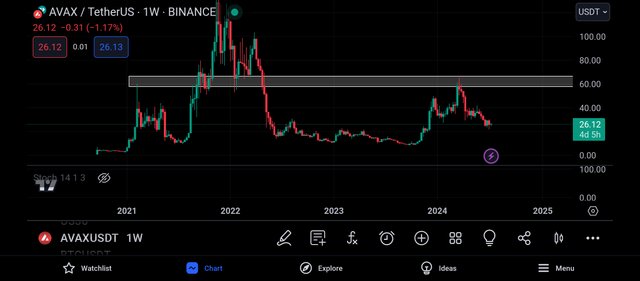
To get more market information, I proceeded to move to the weekly timeframe, just as seen above.
On this timeframe, I noticed that there are more candlestick than on the monthly timeframe, and this is because each candles on this timeframe is formed within the timeframe of 7days.
And looking carefully, I was able to spot a key level and this level is functioning as a resistance level to the market price, and the market is expected to be rejected when it trades towards this level.
On the resistance level, it is believed that there are more sellers than buyers, and as a result of this, the buyers find it difficult to Push the price upwards.
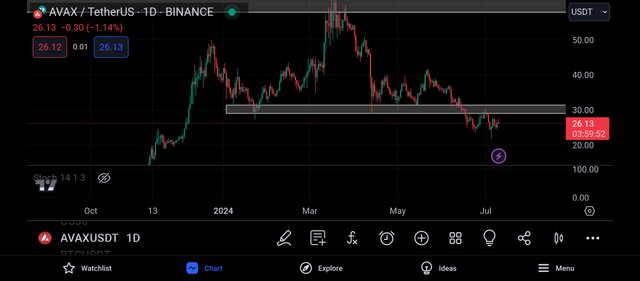
I then continued my analysis by moving to the daily timeframe, and on this timeframe, I could see lots of noise in the market.
I could feel the presence of the buyers and sellers as they struggle to drive the market price to their preferred direction.
And looking carefully at this timeframe, I noticed another key level and this level is functioning as a support level to the market price.
And this support level can be said to be a valid level as the market has made several touches on it before breaking below.
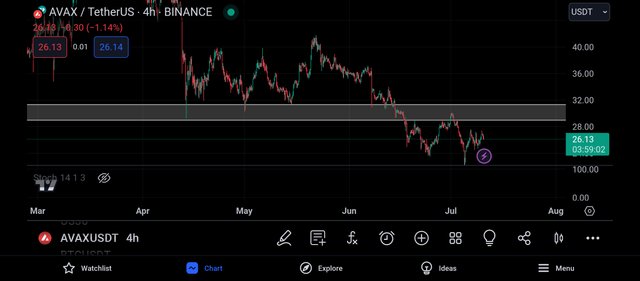
On the 4hr timeframe, the market became more noisy as the buyers and sellers became more aggressive.
And looking at this timeframe, I noticed that the market has broken below this support level and this support level is now functioning as a resistance level to the market price.
And also, the market has retraced upward to retest this broken level, and has continued in its downward movement.
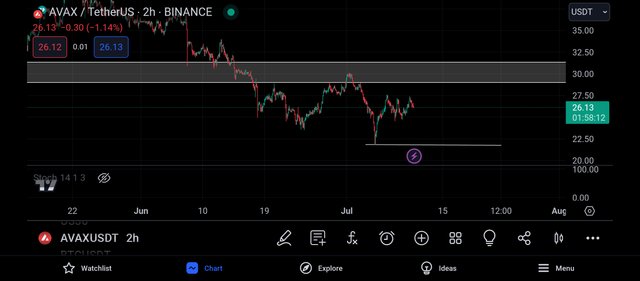
With my bearish bias of the market, I continued to the 2hr timeframe, and as expected, I saw a noisy market.
On this timeframe, I was able to spot an important wick formed by the market, and I expect the market to take out this wick as it continues its movement.
And before taking my entry, I decided to make use of the rsi indicator as a confluence to my trade.
CONFLUENCE USING RELATIVE STRENGTH INDEX INDICATOR
The rsi Indicator is a very important trading tool in the cryptomarket.
The rsi indicator is used to spot oversold and overbought market regions.
And when a market is spotted to be oversold, it is a signal that the market is about to experience a bullish move.
And when a market is spotted to be overbought, it is a signal that the market is about to experience a bearish move.
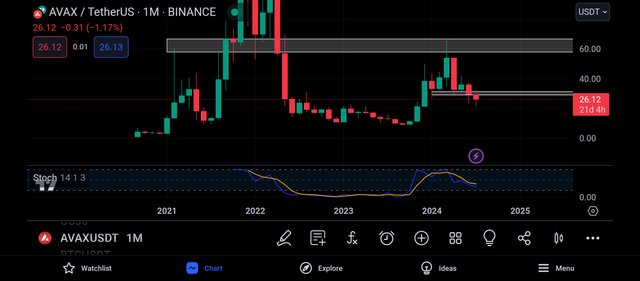
I then continued my analysis by adding the rsi to the monthly timeframe, and on this timeframe, I noticed that the rsi has approached it's 20% line.
And this is an indication that the market is about to be oversold, and an oversold market is one that signals a bulllish trend reversal of the market.
It is a market condition that signals the weakness of the bears and strength of the bulls in the market.
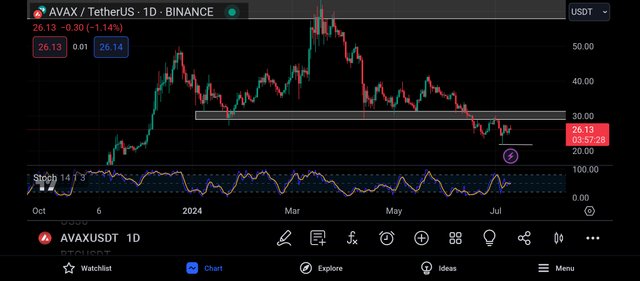
On the daily timeframe, I noticed that the rsi got to it's 20% line and has moved back to its 50% line.
And this is an indication that the market was oversold, which indicates the strength of the bulls over the bears.
And with this, I decided to visit the 2hr timeframe in search of entry into the market.
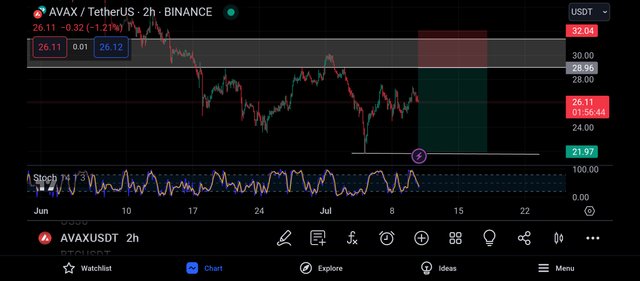
And getting to the 2hr timeframe, I noticed that the market was a bit far from its resistance level, and since I have a bearish bias of the market, I decided to wait for the market to trade towards this level.
I decided to place my entry on the closest resistance level to the market, just as seen above and my take profit was placed on the closest support level to the market.
CONCLUSION
Avalanche is a very nice crypto project in the cryptospace and its native token is what we know to be avax.
And as seen above, I have shared my analysis on AVAXUSDT, and I intend for my post to be taken as an educational content and not a financial advise.
https://x.com/JuecoYoung/status/1811139950697673007
Upvoted! Thank you for supporting witness @jswit.