Top Down Analysis Of ETHUSDT Using Support And Resistance Strategy And RSI Indicator As Confluence

Hello great minds,
It is a great opportunity to come before you all today to share my technical analysis on eth against usdt.
I believe you are all doing perfectly well and are enjoying your activities in the community as you actively promote steemit across various social media platform.
Ethereum is a very big cryptocurrency in the cryptospace and we are well aware of this.
Ethereum happens to be the second most biggest and popular cryptocurrency in the cryptospace.
After Bitcoin which is the driver of all other tokens, ethereum is known to be the next most valuable token, and I am here to share my analysis to it.
ANALYSIS USING SUPPORT AND RESISTANCE STRATEGY
I begin my technical analysis from the higher timeframe, then I descend to the lower timeframe
On the higher timeframe, ideally the monthly timeframe, I seek to determine market trend
The monthly timeframe helps to eliminate market noise from the market and also compress the market to one screen.
And from this, it becomes very easy for the market trend to be predicted.
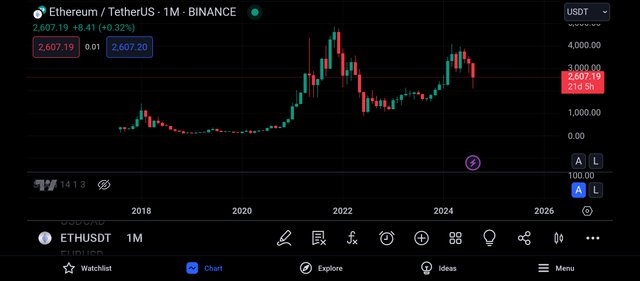
The screenshot above is that of the pair ethusdt on the monthly timeframe.
And as seen above, there are lesser candles on this timeframe and this is as a result of the time it takes for one of this candles to be formed.
On the monthly timeframe, it takes the time period of 1month for each candle to be formed.
And also, it is easy for the overall trend of the market to be detected on this timeframe, as we can see that the market is being bullish.
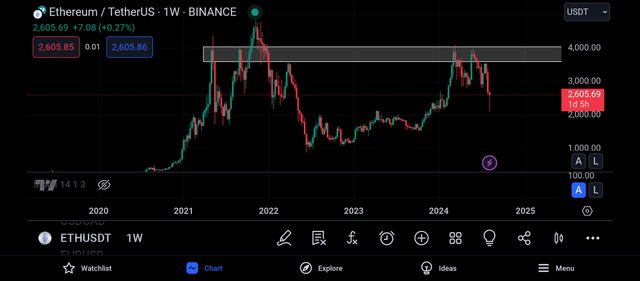
And moving to the weekly timeframe, I noticed that this timeframe has more candlestick than the monthly timeframe and this is because each candle on this timeframe is formed within the timeframe of 7days.
And looking carefully, I was able to spot a key level on this timeframe and this level is functioning as a resistance level to the market price, and the market is expected to be rejected to the bearish side when it trades towards this level.
This level can be said to be a valid level as the market has severally tested and respected it without breaking above.
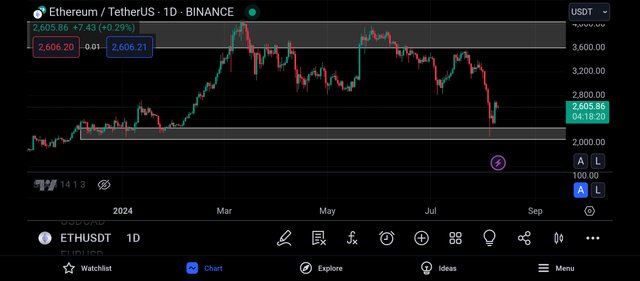
And to get more analysis on the market, I proceeded to move to the daily timeframe, and on this timeframe, I could see much noise in the market as the buyers and sellers are struggling to drive the market to their preferred direction.
And looking carefully, I was able to spot another key level and this level is functioning as a support level to the market.
This level is a valid support level because the market has several touches on it and has been unable to violate it.
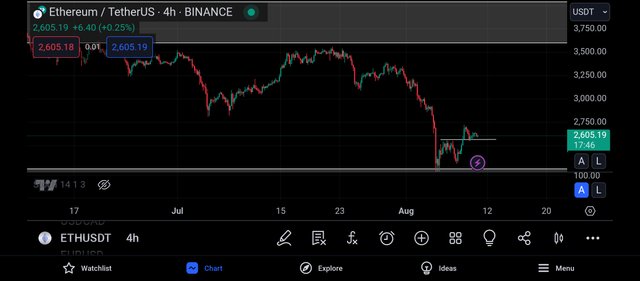
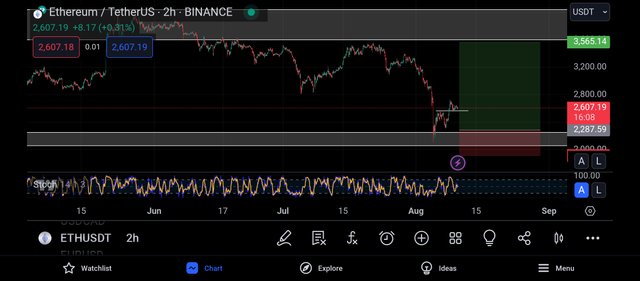
And on the 4hr timeframe, I could see how aggressive the sellers were as they drove the market towards this support level.
And looking carefully, I noticed that the market has been rejected by this level, as I can see the formation of several bullish candles in the market.
On this timeframe, I also noticed the market breaking new structures to confirm it's bullish move, and as such, I decided to move to the 2hr timeframe in search of entry into the market.
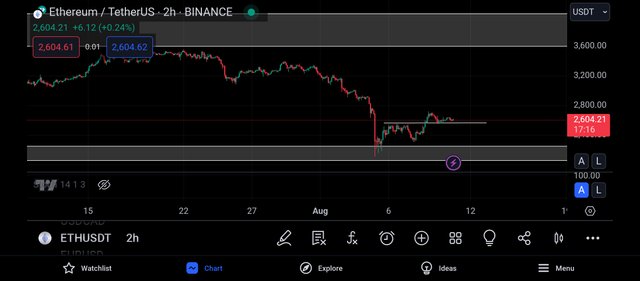
On the 2hr timeframe, I could see how noisy the market is, and I noticed that it has retested this broken structure, and this gave me a bullish bias of the market.
And before entering the market, I decided to search for trading confluence using the relative strength index indicator.
CONFLUENCE USING RELATIVE STRENGTH INDEX INDICATOR
The relative strength index indicator is an indicator that helps to identify overbought and oversold market.
When a market is spotted to be overbought, it is a bearish trend reversal signal and when it is oversold, it is a bullish trend reversal signal.
An overbought market can be spotted when the rsi crosses above the 80% line and an oversold market is detected when the market crosses below the 20% line.
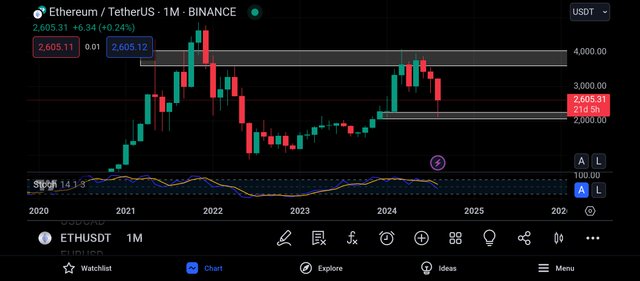
I then decided to begin this phase by applying the rsi to the monthly timeframe, and on this timeframe, I noticed that the market is being overbought.
An overbought market is one that signals a bearish trend reversal of the market, and it is usually detected when the market crosses above its 80% line..
This market condition is one that signals the weakness of the bulls and the strength of the bears in the market, and as such, I decided to move to the 4hr timeframe for more analysis.
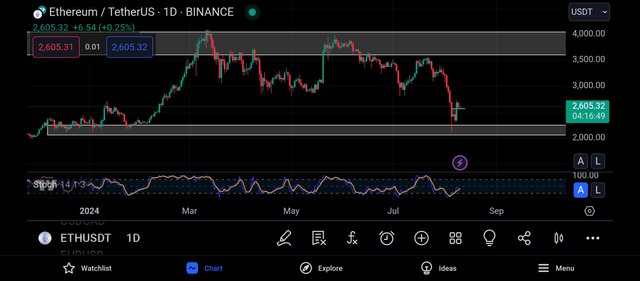
And moving to the daily timeframe, I noticed that the market is was oversold and is recovering back.
From the indicator, I can see that the market is gradually moving away from the oversold region, the bulls are taking control of the market, and when it becomes overbought, the bears will begin their run.
Although, I have a bullish bias of the market, I then decided to check on the 2hr timeframe for more confluence.
Getting to the 2hr timeframe, I decided to place my entry on the closest valid support level to the market and my take profit was placed on the closest resistance level to the market.
CONCLUSION
I have shared my analysis on ethusdt beginning from the monthly to the weekly to the daily and to the hourly.
From my analysis, I expect to see a bullish move on ethusdt.
https://x.com/JuecoYoung/status/1822386540275769843
Upvoted! Thank you for supporting witness @jswit.