Topdown Analysis Of SOLUSDT Using Support And Resistance Strategy And RSI Indicator As A Confluence
Hello great minds,
It is a wonderful opportunity to come before you all today to discuss on an issue of great importance in the cryptospace.
I believe you are doing perfectly fine and are enjoying your activities in the community as you actively promote steemit across various social media platform.
Today, I will be sharing my analysis on solusdt, and Solana is a popular token in the cryptospace.
Solana is a very popular project in the cryptospace and has brilliant team who are diligent and have great fundamentals, and as such, I will be sharing my analysis.
Please stay tuned and check out my analysis on this great token.
ANALYSIS USING SUPPORT AND RESISTANCE STRATEGY
My analysis of the cryptomarket often begins from the higher timeframe to the lower timeframe, but I prefer beginning mine from the monthly timeframe.
The monthly timeframe helps me a lot in filtering out noise from the market, and alongside that, it also plays a huge role in the identification of market trends.
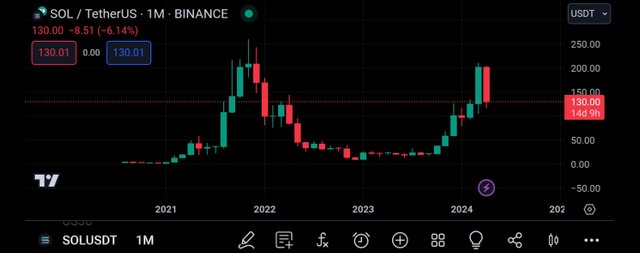
I then began my analysis from the monthly timeframe just as seen above.
From the screenshot above, we can see that there are bearish and bullish candles in the market.
And also, we can see there are no noise on the price chart as each candle is formed within the space of 1month.
Also, we can easily determine the trend of the market, and from the above screenshot, we can see that the market is still bearish overall, although it's most recent leg is bullish.
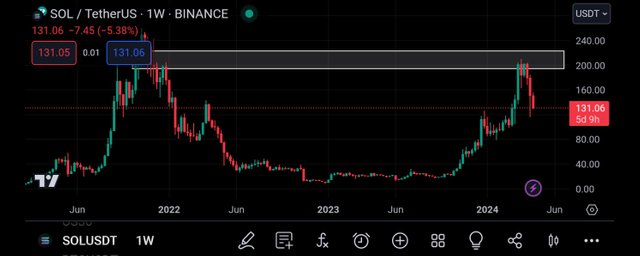
I then moved to the weekly timeframe to continue my analysis, and on this timeframe, I saw more market activities.
Also, I was able to spot a key resistance level to the price chart, and this level has proven to be a valid market level.
From the above screenshot, we can see that the market has gotten to this level and has been rejected just as expected.
Upon the formation of a bearish rejection candle, we can thus join the market.
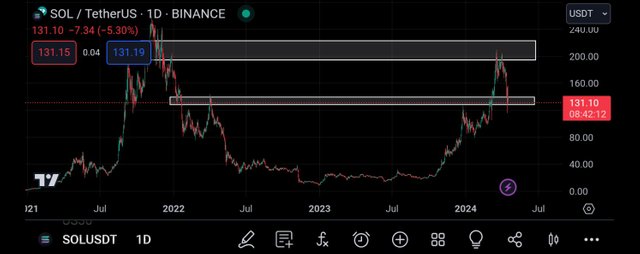
Continuing my analysis on the daily timeframe, I saw more market activities than on the weekly timeframe.
And on this timeframe, I was able to detect another key level, and this level is acting as a support level to market price.
Getting to this level, I expect to see a bullish rejection of the market, and when this happens, I can thus join the market on a bullish move.
And inorder to confirm this, I proceeded to the 4hr timeframe.
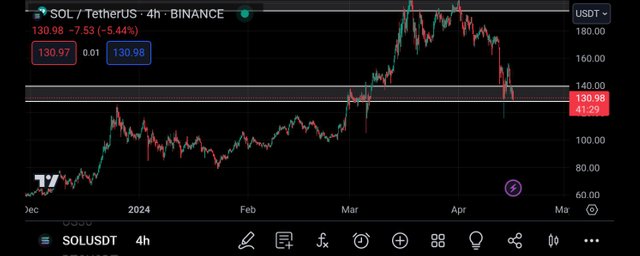
Moving to the 4hr timeframe, I can see more market noise, and also I notice that the market has been rejected from this level.
Also, I can see that the market has retraced to retest this level again, and upon the formation of a bullish rejection candle, I will seek to join the market.
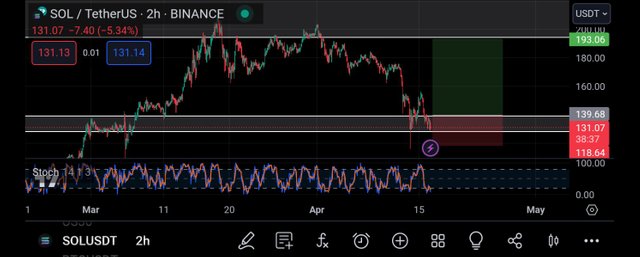
Then I decided to continue my analysis from the 2hr timeframe, which is the timeframe which I enter the market.
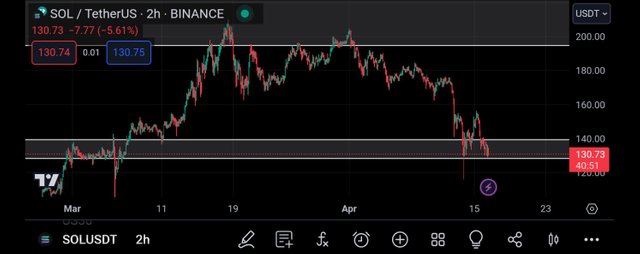
Moving to the 2hr timeframe, I can see more market activities which is expected, as each candle on this timeframe is formed within the timeframe of 2hrs.
Looking carefully, I can see the formation of bullish candle which is the confirmation I search for.
And before entering the market, I decided to search for confluence using rsi indicator.
CONFLUENCE USING RELATIVE STRENGTH INDEX INDICATOR
The rsi indicator is a technical tool that is used to detect overbought and oversold market.
When the rsi oscillator crosses above the 80% line, the market is said to be overbought and this is known to be a bearish trend reversal signal.
And when the rsi oscilator crosses below the 20% level, the market is said to be oversold.
An oversold market signifies a bullish trend reversal signal, that is , the market is expected to move in the upside direction.
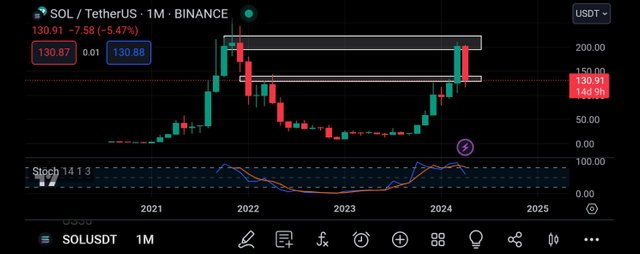
I added the rsi indicator first to the monthly timeframe just as seen above.
On this timeframe, we can see that the rsi has crossed above the 80% line, and this is a signal that the market is being overbought.
An overbought market is usually seen as a bearish trend reversal signal.
And with this, I decided to check on the lower timeframe for more confluence.
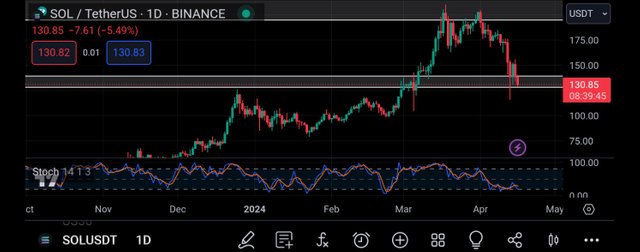
Moving to the daily timeframe, I saw that the market has crossed below it's 20% line, and this is an indication that the market is being oversold.
An oversold market signals a bullish trend reversal signal, and this is in alliance with our analysis using support and resistance strategy.
With this, I decided to move to the 2hr timeframe in search of entry into the market.
Then I moved to the 2hr timeframe, and on this timeframe I notice that the rsi is below it's 20% line.
And this is an indication that the market is being oversold, and on oversold market is seen to be a bullish trend reversal signal.
And at such, i decided to join the market from the closest support level, and I placed my take profit on the closest resistance level, just as seen above.
CONCLUSION
Solana is a very good project in the cryptospace but I encourage all to make their own research before investing in any token.
My post should not be taken as a financial advise rather as an educational content.
Upvoted! Thank you for supporting witness @jswit.
https://twitter.com/JuecoYoung/status/1780350464149639171