Topdown Analysis Of AVAXUSDT Using Support And Resistance Strategy And RSI Indicator As Confluence
Hello great minds,
I feel honored to approach you all today to discuss on a very important issue in the cryptospace.
I believe you are all doing perfectly fine and are enjoying your activities in the community as you actively promote steemit across various social media platform.
Today I will be sharing my analysis on the token of avalanche network which is avax, and I will be sharing my analysis on avax against usdt.
Please stay tuned as I share my analysis
ANALYSIS USING SUPPORT AND RESISTANCE STRATEGY
Technical analysis are best started from the higher timeframe and then to the lower timeframe.
Some analyst prefer starting their analysis from the daily timeframe, down to the fewer minutes, but I begin mine from the monthly timeframe.
The monthly timeframe helps me to compress market activities and display them on a screen.
And the monthly timeframe also helps in eliminating unnecessary noise from the market.
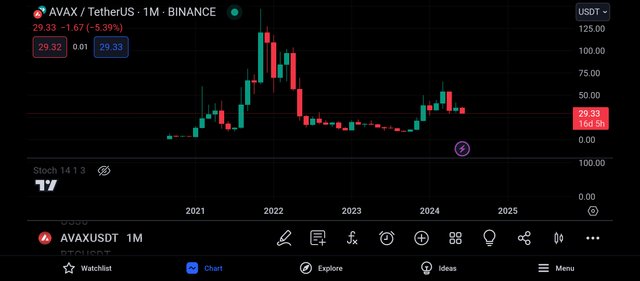
Beginning with the monthly timeframe of the pair AVAXUSDT, we can see the formation of bullish and bearish candles.
We can also see that there are few candles on this timeframe and this is because each candlestick were formed within the space of 1month.
Also from the above screenshot, we can notice that it is easier for the market trend to be identified, and from the above screenshot we see that the most recent leg of the market is bullish.
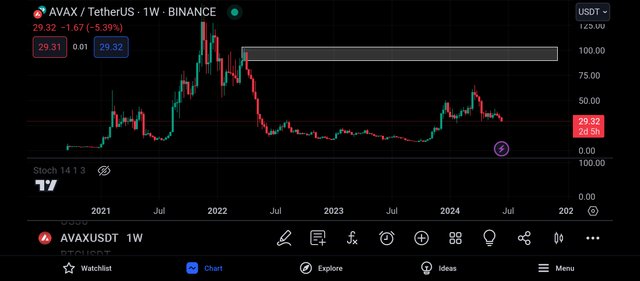
Moving to the weekly timeframe, I noticed that there are more candles on this timeframe than on the monthly timeframe and this is because each candle on this timeframe is formed during the waiting period of 1week.
And looking carefully at this chart, I was able to spot a key level and this level is functioning as a resistance level to the market price.
And as expected, when the market trades towards this level, it is expected to be rejected to the downside as there are much sellers on this level than on the monthly timeframe.
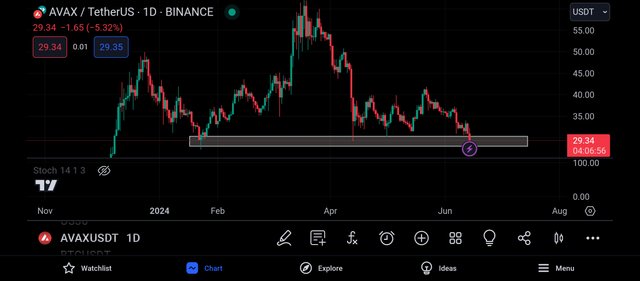
Getting to the daily timeframe, I could see more market activities, as each candle here is formed within the time period of 1 day.
And looking carefully, I was able to spot a key level on the market, and this level is functioning as a support level to the market price.
And from the above screenshot, we can see that this level is a valid one, as it has been severally tested and respected by the market price.
And we expect to see this level get respected again and again when the market trades towards it.
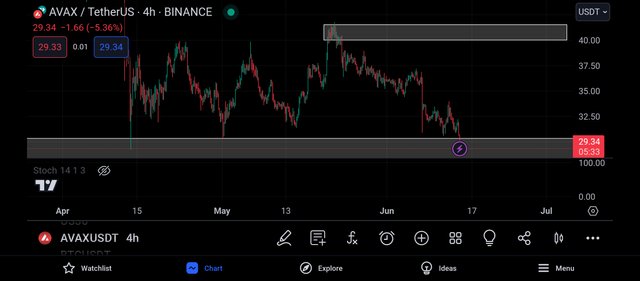
On the 4hr timeframe, I could see clearly that the market has traded towards this support level.
And as history has shown, the market is expected to be rejected by this level, this means, we expect to see a bullish rejection from the market.
From the formation of a bullish rejection candle, we can then search for bullish entries into the market.
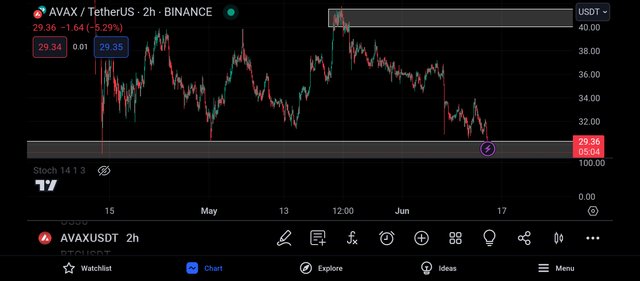
I then continued my analysis to the 2hr timeframe, as it is on this timeframe that I search for my entry.
And on this timeframe also, we can see a level marked upward, and this level is likely to be my take profit level when I decide to buy the market.
With my bulllish bias of the market, I decided to search for confluence using the relative strength index indicator.
CONFLUENCE USING RELATIVE STRENGTH INDEX INDICATOR
The rsi Indicator is a very important trading tool in the cryptomarket.
The rsi indicator is used to spot oversold and overbought market regions.
And when a market is spotted to be oversold, it is a signal that the market is about to experience a bullish move.
And when a market is spotted to be overbought, it is a signal that the market is about to experience a bearish move.
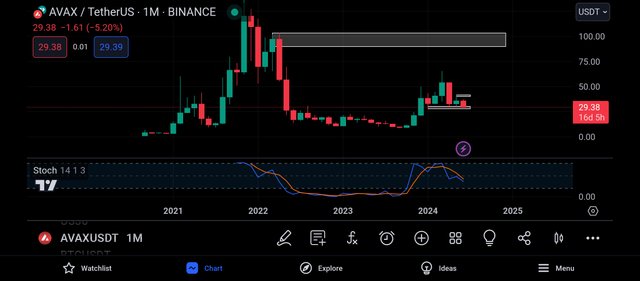
From the screenshot above which is the monthly screenshot of the pair AVAXUSDT, we can see that the rsi is approaching the 20% line.
This implies that the market is about to be oversold and an oversold market is one understood to mean a bullish trend reversal.
An oversold market signals the change in market strength from the bears to the bulls, and as such, we can expect to see a bullish rejection candle.
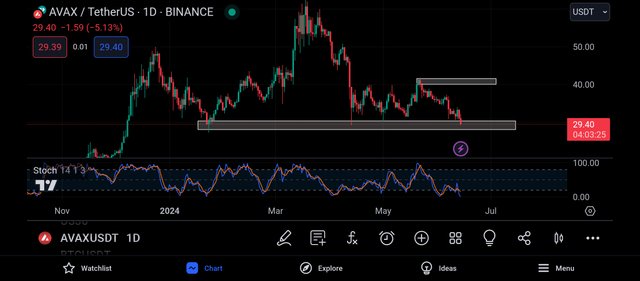
Getting to the daily timeframe, we can see that the rsi has already approached it's 20% line.
And this is an indication that the market is already oversold on the daily timeframe.
And as I explained earlier, an oversold market signals a bullish trend reversal, that is a change is market structure from being bearish to being bullish.
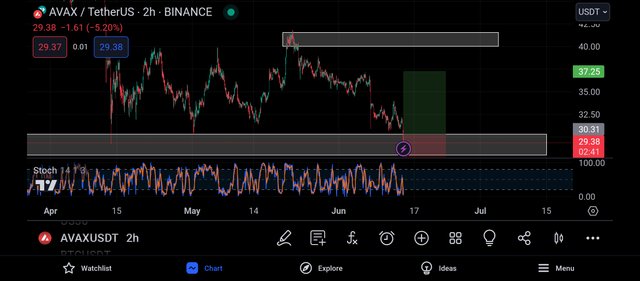
On getting to the 2hr timeframe, I also noticed that the market is being oversold and this is a signal it enter a buy in the market.
I then proceed to place a buy on the market closest support level and my take profit was placed on the closest resistance level to the market price.
CONCLUSION
Avalanche is a very nice crypto project in the cryptospace and its native token is what we know to be avax.
And as seen above, I have shared my analysis on AVAXUSDT, and I intend for my post to be taken as an educational content and not a financial advise.
Upvoted! Thank you for supporting witness @jswit.
https://x.com/JuecoYoung/status/1801720726053077097