Top Down Analysis Of ETHUSDT Using Support And Resistance Strategy And RSI Indicator As Confluence

Hello great minds,
It is a great opportunity to come before you all today to share my technical analysis on eth against usdt.
I believe you are all doing perfectly well and are enjoying your activities in the community as you actively promote steemit across various social media platform.
Ethereum is a very big cryptocurrency in the cryptospace and we are well aware of this.
Ethereum happens to be the second most biggest and popular cryptocurrency in the cryptospace.
After Bitcoin which is the driver of all other tokens, ethereum is known to be the next most valuable token, and I am here to share my analysis to it.
ANALYSIS USING SUPPORT AND RESISTANCE STRATEGY
I begin my technical analysis from the higher timeframe, then I descend to the lower timeframe
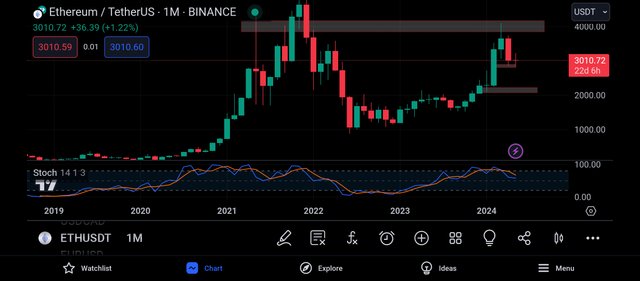
On the higher timeframe, ideally the monthly timeframe, I seek to determine market trend
The monthly timeframe helps to eliminate market noise from the market and also compress the market to one screen.
And from this, it becomes very easy for the market trend to be predicted.
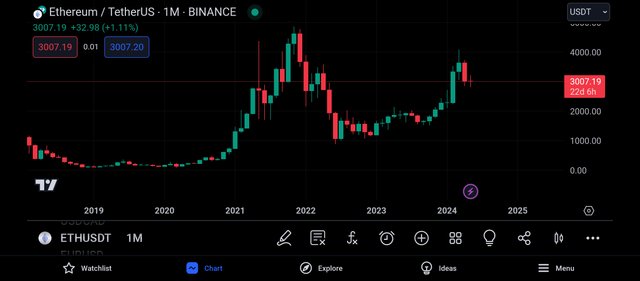
The screenshot above is that of the pair ethusdt on the monthly timeframe.
And as seen above, there are lesser candles on this timeframe and this is as a result of the time it takes for one of this candles to be formed.
On the monthly timeframe, it takes the time period of 1month for each candle to be formed.
And also, it is easy for the overall trend of the market to be detected on this timeframe, as we can see that the market is being bullish.
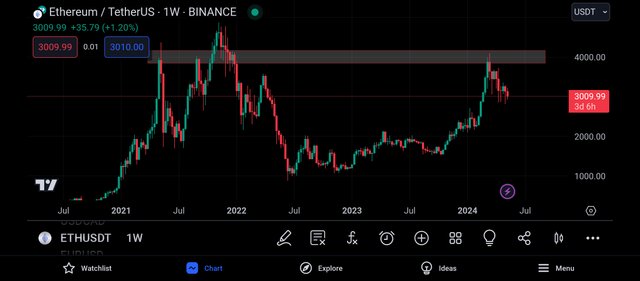
Then I moved to the weekly timeframe for more market analysis, and on this timeframe I could see more market activities than on the monthly timeframe.
On this timeframe, I was able to detect a key market level, and this level is acting as a resistance level to the market price.
And it is expected that whenever the market gets to this level, it gets rejected to the downside, and this level is a valid level because it has been severally respected by the market.

Then I continued my analysis by moving to the daily timeframe, and on this timeframe, I could see more market analysis.
I could see the strength of the sellers and buyers in the market as they strive to push price to their preferred direction.
Also on this timeframe, I was able to spot another level which will be functioning as a support level to the market price.
And it is expected that when the market gets to this level, it should be rejected by the level to the upside.
Then I moved to the 4hr timeframe for more market analysis.
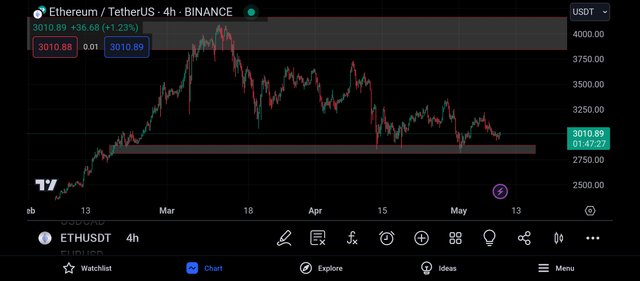
Getting to the 4hr timeframe I could see lots of noise in the market and this is as a result of power tussle between buyers and sellers.
Looking carefully at this timeframe, I was able to spot another level, this level seems to be a valid level as it has been respected severally by market price.
This level is functioning as a support level to the market price and it's duty is to act as a resistance to the sellers inorder to prevent them from pushing the market any lower.
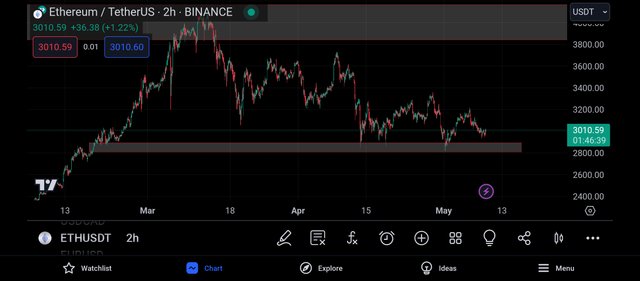
On the two hour timeframe, I could see the market trading towards the marked support level.
And it is expected for the market to be rejected as it trades towards this support level, and with this, my bulllish bias got strengthened and I decided to apply the rsi indicator as a confluence to my trade.
CONFLUENCE USING RELATIVE STRENGTH INDEX INDICATOR
The relative strength index indicator is an indicator that helps to identify overbought and oversold market.
When a market is spotted to be overbought, it is a bearish trend reversal signal and when it is oversold, it is a bullish trend reversal signal.
An overbought market can be spotted when the rsi crosses above the 80% line and an oversold market is detected when the market crosses below the 20% line.
Applying the rsi indicator to the monthly timeframe, I noticed that it has crossed it's 80% line, and this is an indication that the market is being overbought.
An overbought market is expected to be sold, and this implies that the market is expected to experience a bearish trend reversal.
And with such, I decided to move to the daily timeframe for more market analysis.
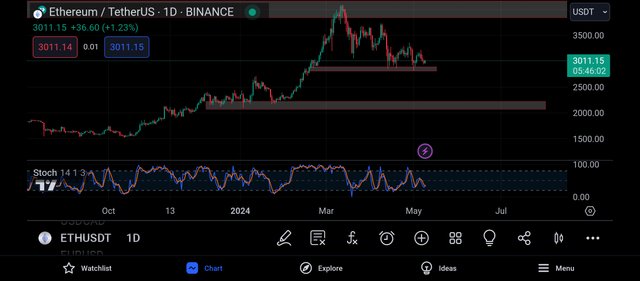
Getting to the daily timeframe, I could see that the rsi has gotten to its 20% region, and this signifies that the market is being oversold.
And this implies that the market is expected to experience a bullish move, as an oversold region is seen to be a bullish trend reversal signal.
And this is in alliance with my strategy using support and resistance strategy.
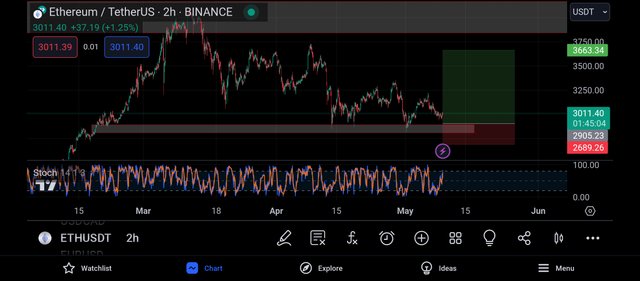
Then I moved to the 2hr timeframe insearch of entry into the market.
Having my bullish bias, I located the closest support level to the market price and I placed my buy order.
And then I placed my take profit on the resistance level closest to the market price, just as seen above.
CONCLUSION
I have shared my analysis on ethusdt beginning from the monthly to the weekly to the daily and to the hourly.
From my analysis, I expect to see a bullish move on ethusdt.
Upvoted! Thank you for supporting witness @jswit.
https://twitter.com/JuecoYoung/status/1788688227282436347
Nice analysis, I still expect a big move after this consolidations