Topdown Analysis Of BTCUSDT Using Support And Resistance Strategy And RSI Indicator As A Confluence
Hello great minds,
It is a great opportunity to appear before you all today to share my analysis on bitcoin.
I believe you are all doing perfectly fine and are enjoying your activities in the community as you actively share in steemit promotion across various social media platform.
Bitcoin as we know it, is the father of all other cryptocurrency and it is worth carrying an analysis on, since it is the driver of all other cryptocurrency in the cryptospace.
Today, I will sharing my analysis of btcusdt and I will be beginning from the monthly timeframe.
ANALYSIS USING SUPPORT AND RESISTANCE STRATEGY
My analysis often begin from the higher timeframe and it moves to the lower timeframe.
On the higher timeframe like the monthly timeframe, I identify market trends, and on other timeframe I search for key market levels and also search for entries into the market.
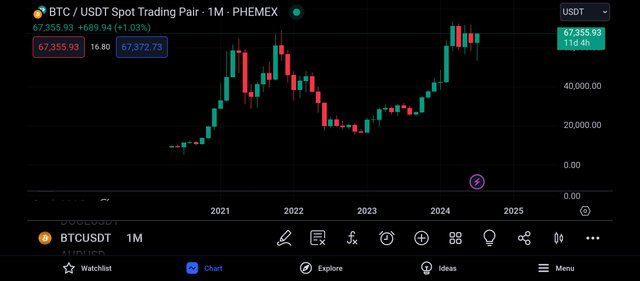
The above screenshot is that of btcusdt on the monthly timeframe as we can all confirm.
And from the above screenshot, we can see that there are less candles on this timeframe, and this is because each candle formed on this timeframe takes an activity period of one month.
Also on this timeframe, we can notice that the market trend is easily identified, and from the screenshot above, we can see that Bitcoin market is bullish overall.
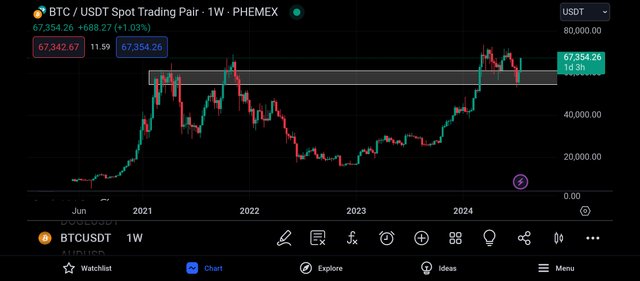
I then continued my analysis by moving to the weekly timeframe, and on this timeframe, I could see the market more clearly.
I could see more market candles on this timeframe than on the monthly timeframe, as each candle is formed within the time period of 7days.
And I was able to identify a key level on this timeframe, and this level is a valid level as it has previously held the market price before, and I expect to see notable reactions on this timeframe whenever the market trades towards it.
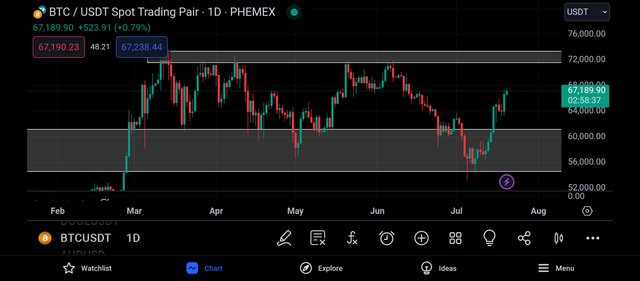
Moving to the daily timeframe, I could see the market movement more clearly, I could feel the presence of the buyers and sellers as they struggle to drive the market to their preferred direction.
And from the above screenshot, I can see that the recent bullish phase of the market was as a result of its rejection from the support level I marked earlier.
And looking carefully, I noticed that there is a resistance level just above the market price, and this level is a strong level.
It is expected for the market to be rejected when it trades towards this level
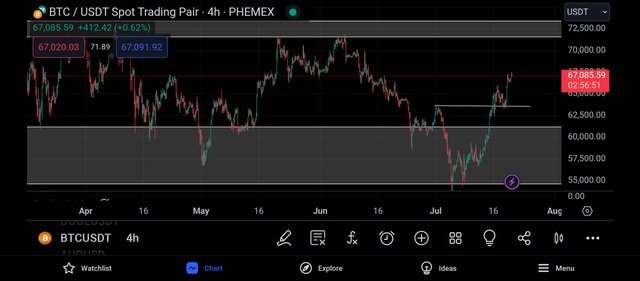
Getting to the 4hr timeframe, I could see how noisy the market is, I could see the manipulation done by the whales in the market.
And I noticed a bullish break of structure in the market which confirms that the market will continue on its bullish move, until it gets to its resistance level.
This resistance level has been tested severally by the market and the market has been unable to break above it.
With this analysis, my bullish bias of the market became strengthened, I expect to see the market trade towards its resistance level before being rejected to the downside.
And as such, I decided to search for trading confluence using the rsi indicator.
CONFLUENCE USING RELATIVE STRENGTH INDEX INDICATOR
The relative strength index indicator is an indicator that helps to identify overbought and oversold market.
When a market is spotted to be overbought, it is a bearish trend reversal signal and when it is oversold, it is a bullish trend reversal signal.
An overbought market can be spotted when the rsi crosses above the 80% line and an oversold market is detected when the market crosses below the 20% line.
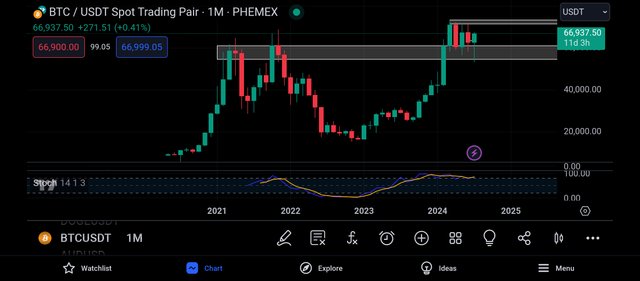
I then continued my analysis by applying the rsi to the monthly timeframe, and on this timeframe, I can see that the rsi has crossed above its 80% line.
And this is an indication that the market is being overbought, and an overbought market signals a bearish trend reversal of the market.
It is a market condition showing the weakness of the bulls and the strength of the bears.
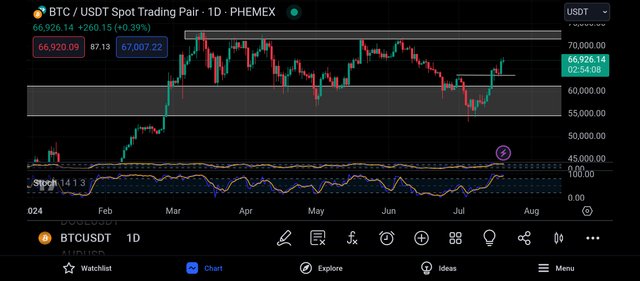
On the daily timeframe also, I can see that the rsi has crossed above its 80% line, and this is an indication that the market is being overbought.
And an overbought market as we know is one that signals a bearish trend reversal of the market.
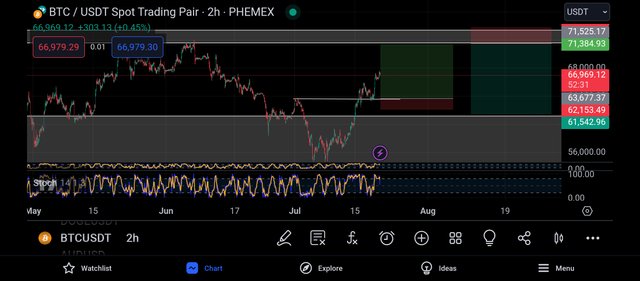
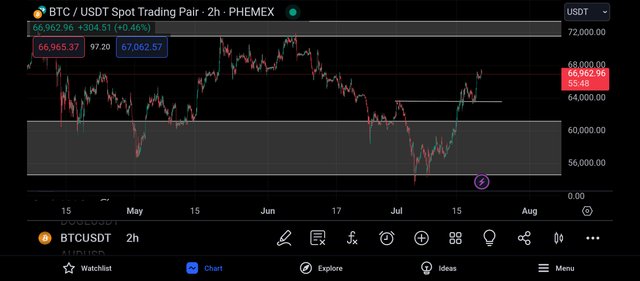
And as such, I decided to move to the 2hr timeframe in search of entry into the market.
Here, I also noticed that the market is being overbought, and as such, I placed my buy order on the closest support level to the market, although I expect the market to retrace to this level.
And my take profit was placed on the closest resistance level to the market, just as seen above.
CONCLUSION
Bitcoin is the father of all cryptocurrency and it is the driver of all other altcoins in the cryptomarket.
I have shared my analysis on the market and I expect to see a momentary bullish move.
https://x.com/JuecoYoung/status/1814784028089909583
Upvoted! Thank you for supporting witness @jswit.