Topdown Analysis Of BTCUSDT Using Support And Resistance Strategy And RSI Indicator As A Confluence
Hello great minds,
It is a great opportunity to appear before you all today to share my analysis on bitcoin.
I believe you are all doing perfectly fine and are enjoying your activities in the community as you actively share in steemit promotion across various social media platform.
Bitcoin as we know it, is the father of all other cryptocurrency and it is worth carrying an analysis on, since it is the driver of all other cryptocurrency in the cryptospace.
Today, I will sharing my analysis of btcusdt and I will be beginning from the monthly timeframe.
ANALYSIS USING SUPPORT AND RESISTANCE STRATEGY
My analysis often begin from the higher timeframe and it moves to the lower timeframe.
On the higher timeframe like the monthly timeframe, I identify market trends, and on other timeframe I search for key market levels and also search for entries into the market.
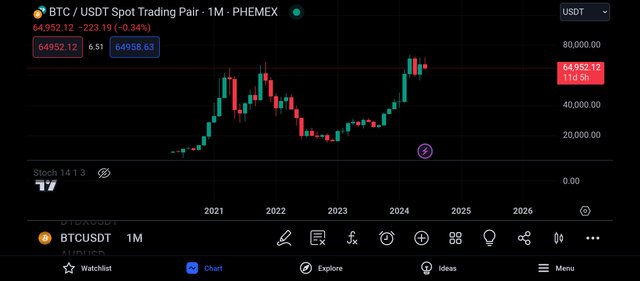
The above screenshot is that of btcusdt on the monthly timeframe as we can all confirm.
And from the above screenshot, we can see that there are less candles on this timeframe, and this is because each candle formed on this timeframe takes an activity period of one month.
Also on this timeframe, we can notice that the market trend is easily identified, and from the screenshot above, we can see that Bitcoin market is bullish overall.
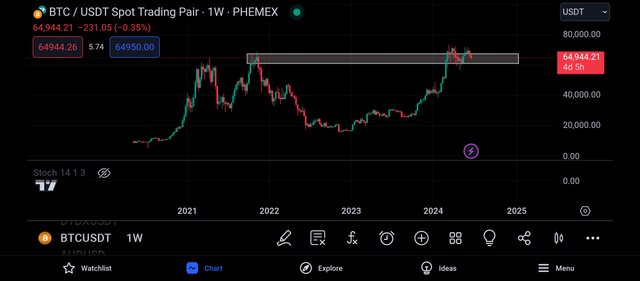
I then continued my analysis on the weekly timeframe, and on this timeframe, I could see lots of candlestick.
The candlestick on this timeframe is more than those on the monthly timeframe, and this is because each candle on this timeframe is being formed within a trading period of 1week.
And on this timeframe, I was able to spot a key level and this level is functioning as a resistance level on the price chart, and on this level, there tend to be more sellers than buyers on this level.
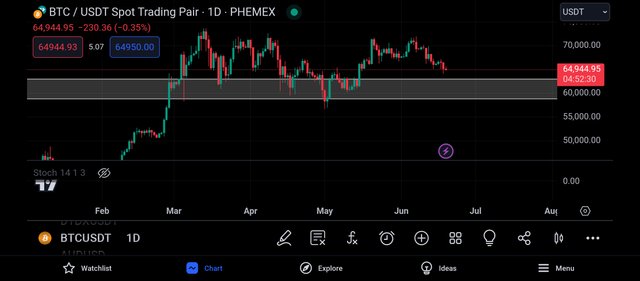
Getting to the daily timeframe, I saw more candlestick as expected, but I noticed something more unique.
When I looked at the chart, I noticed that the market has broken above this resistance level, and now this resistance level is functioning as a support level.
With this, I expect to see a bearish retracement of the market as it moves to retest the broken resistance level.
And upon this retracement, I expect to see a bullish rejection afterwards, which will make the market continue its bullish move.
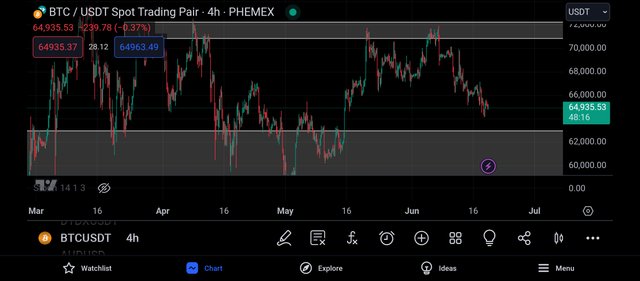
To get more market details, I decided to visit the 4hr timeframe, and on this timeframe, I could see how noisy the market is.
I could see series of bullish and bearish candles, as many are a result of manipulation from whales in the market.
And on this timeframe, I was able to spot another key level, and this level is functioning as a resistance level to the market price.
And from the above screenshot, we can see that this resistance level is a valid one , as the market has made several touches on this level.
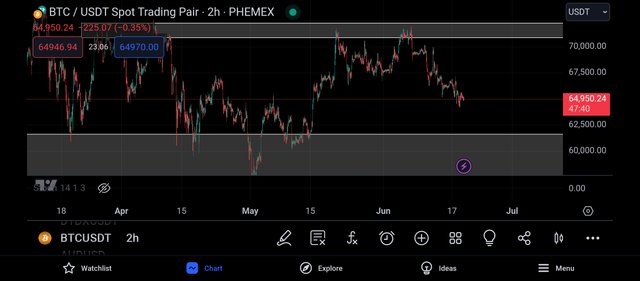
Having my bullish bias of the market, I moved to the 2hr timeframe.
And on this timeframe, I could see that the market is moving aggressively to the support level, and once it gets there, I will be ready to take my buy order on the pair BTCUSDT.
With this, I decided to search for confluence using the relative strength index indicator.
CONFLUENCE USING RELATIVE STRENGTH INDEX INDICATOR
The relative strength index indicator is an indicator that helps to identify overbought and oversold market.
When a market is spotted to be overbought, it is a bearish trend reversal signal and when it is oversold, it is a bullish trend reversal signal.
An overbought market can be spotted when the rsi crosses above the 80% line and an oversold market is detected when the market crosses below the 20% line.
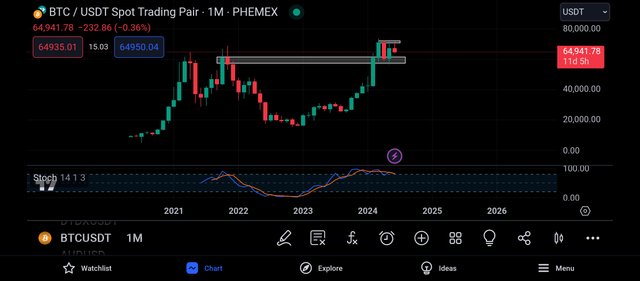
Applying the rsi on the monthly timeframe, I noticed that the rsi has crossed above its 80% line, and this is an indication that the market is being overbought.
An overbought market often signals a bearish trend reversal, that is, a change in market strength from the buyers to the sellers.
That is, we expect to see the market experience a bearish move in the market, probably the formation of some bearish candles.
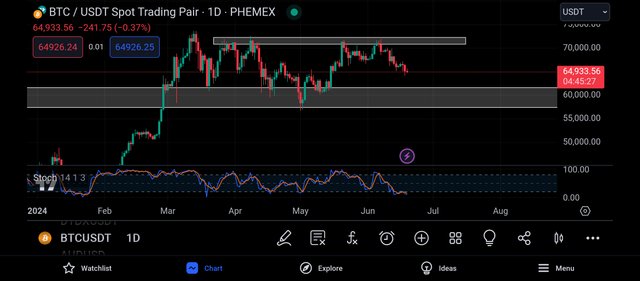
I then continued with my analysis by moving to the daily timeframe, and on this timeframe, I could see that the market is being oversold, as the rsi has crossed below its 20% line.
An oversold market often signals a bulllish trend reversal market, a market condition whereby the sellers are getting weak and the buyers are gaining strength.
And in this condition, we expect to see the formation of bullish candles in the market.
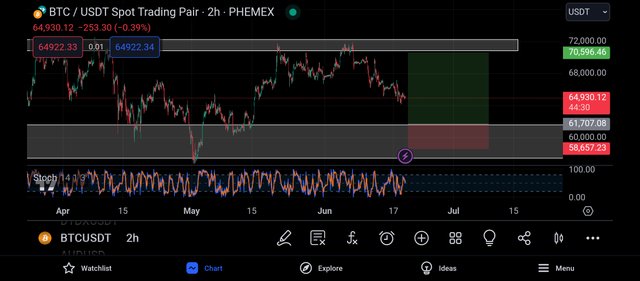
Having my bullish bias, I moved to the 2hr timeframe in search of entry.
On this timeframe, I placed my entry on the closest support level to the market and my take profit on the closest resistance level to the market, just as seen above.
Although, I expect the market to retrace towards this resistance level before continuing on its bullish move.
CONCLUSION
Bitcoin is the father of all cryptocurrency and it is the driver of all other altcoins in the cryptomarket.
I have shared my analysis on the market and I expect to see a momentary bearish move.
https://x.com/JuecoYoung/status/1803544444982960209
Upvoted! Thank you for supporting witness @jswit.