Topdown Analysis Of BTCUSDT Using Support And Resistance Strategy And RSI Indicator As A Confluence
Hello great minds,
It is a great opportunity to appear before you all today to share my analysis on bitcoin.
I believe you are all doing perfectly fine and are enjoying your activities in the community as you actively share in steemit promotion across various social media platform.
Bitcoin as we know it, is the father of all other cryptocurrency and it is worth carrying an analysis on, since it is the driver of all other cryptocurrency in the cryptospace.
Today, I will sharing my analysis of btcusdt and I will be beginning from the monthly timeframe.
ANALYSIS USING SUPPORT AND RESISTANCE STRATEGY
My analysis often begin from the higher timeframe and it moves to the lower timeframe.
On the higher timeframe like the monthly timeframe, I identify market trends, and on other timeframe I search for key market levels and also search for entries into the market.
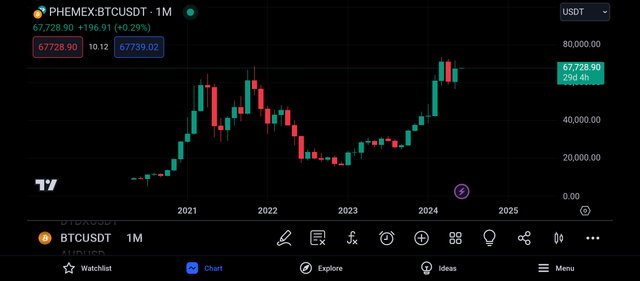
The above screenshot is that of btcusdt on the monthly timeframe as we can all confirm.
And from the above screenshot, we can see that there are less candles on this timeframe, and this is because each candle formed on this timeframe takes an activity period of one month.
Also on this timeframe, we can notice that the market trend is easily identified, and from the screenshot above, we can see that Bitcoin market is bullish overall.
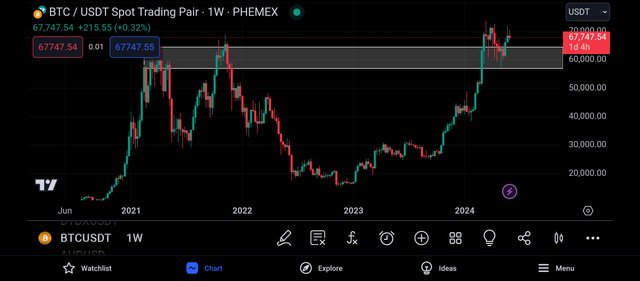
Getting to the weekly timeframe, I noticed that there are more candlestick than on the monthly timeframe, and this is because each candle on this timeframe is being formed after a complete period of 1week.
On this timeframe, I was able to spot a key level and this level was functioning as a resistance level untill it became broken and is now functioning as a support level to the market price.
And from the above screenshot we can see that the market has broken this level and has retraced to retest this broken level.
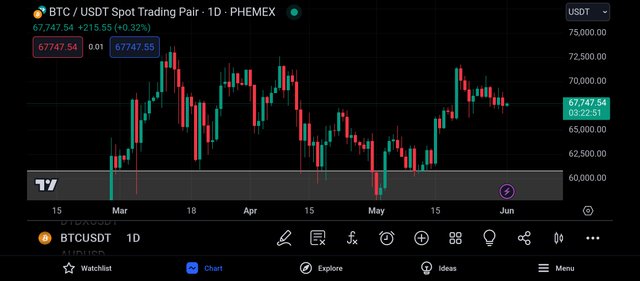
On the daily timeframe, I could see the market movement more clearly and I also realised that there are more candles on this timeframe than on the weekly timeframe.
Looking at the timeframe carefully, I was able to refine my support level, and as seen above the market has made several touches on this level and has been unable to break below it.
And it is expected for the market to be rejected once it's trades towards this level again.
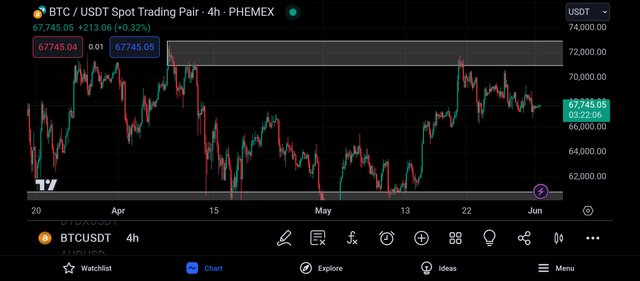
Getting to the 4hr timeframe, I could see more activities on the market.
I could feel the presence of the buyers and sellers as they struggle to drive price to their preferred direction.
And looking carefully at this timeframe, i was able to detect another important level which is functioning as a resistance level to the price chart.
And it is expected for the market to be rejected when the market approaches this level.
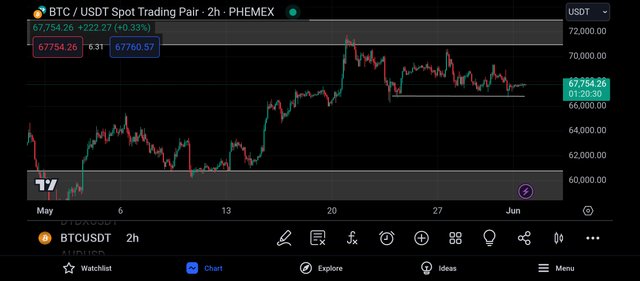
Getting to the 2hr timeframe, I could see the market more clearly.
From my analysis, I have a bearish bias of the market although I expect the market to retrace upward to the resistance level before moving downward.
But before entering a trade, I make use of relative strength index indicator to act as confluence to the market.
CONFLUENCE USING RELATIVE STRENGTH INDEX INDICATOR
The relative strength index indicator is an indicator that helps to identify overbought and oversold market.
When a market is spotted to be overbought, it is a bearish trend reversal signal and when it is oversold, it is a bullish trend reversal signal.
An overbought market can be spotted when the rsi crosses above the 80% line and an oversold market is detected when the market crosses below the 20% line.
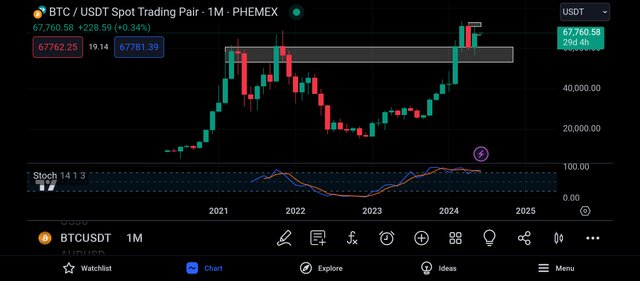
I then begin with the monthly timeframe and on this timeframe, I noticed that the rsi has crossed above its 80% line.
And this can be seen as a bearish trend reversal signal, and the market can be said to be overbought, as an overbought market is a market signaling a change in strength from the buyers to sellers in the market.
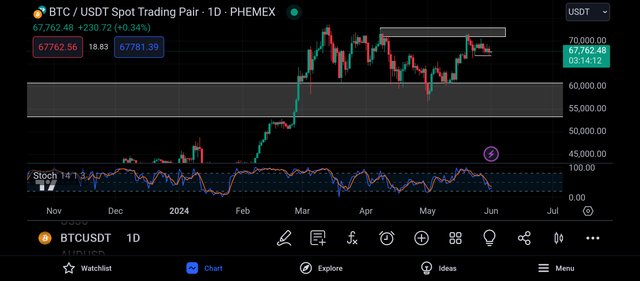
And getting to the daily timeframe, I noticed that the rsi is approaching its 20% line.
And this is an indication that the market is being oversold, and an oversold market is one known to signal a bullish trend reversal.
An oversold market tells a change in market strength from the sellers to the buyers.
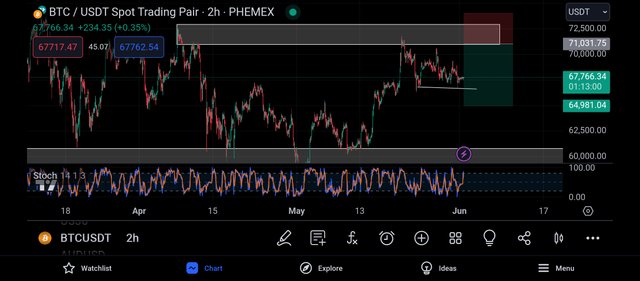
Still with my bearish bias, I searched for the closest resistance level to the market price and I placed my entry on that level.
Then I placed my take profit on the closest support level to the market price, just as seen above.
CONCLUSION
Bitcoin is the father of all cryptocurrency and it is the driver of all other altcoins in the cryptomarket.
I have shared my analysis on the market and I expect to see a momentary bearish move.
https://twitter.com/JuecoYoung/status/1797028323496726928
Upvoted! Thank you for supporting witness @jswit.
Great analysis jueco, only for a short-term movement thou, because I see no reason to short BTC at the moment.
The market is very bullish, and from my end, all I could see is the descending triangle which normally gives a boost for an upward massive market movement.