Topdown Analysis Of BTCUSDT Using Support And Resistance Strategy And RSI Indicator As A Confluence
Hello great minds,
It is a great opportunity to appear before you all today to share my analysis on bitcoin.
I believe you are all doing perfectly fine and are enjoying your activities in the community as you actively share in steemit promotion across various social media platform.
Bitcoin as we know it, is the father of all other cryptocurrency and it is worth carrying an analysis on, since it is the driver of all other cryptocurrency in the cryptospace.
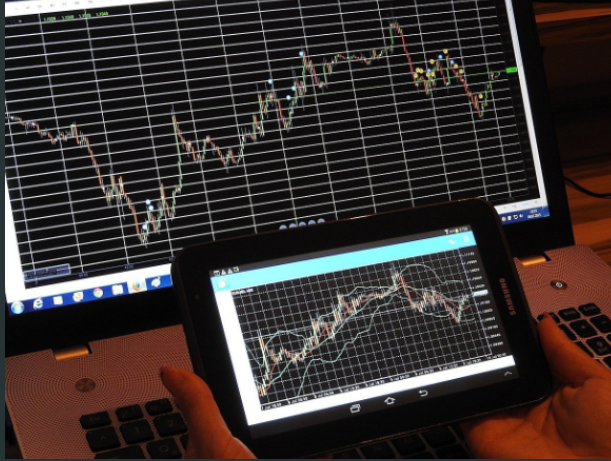
Today, I will sharing my analysis of btcusdt and I will be beginning from the monthly timeframe.
ANALYSIS USING SUPPORT AND RESISTANCE STRATEGY
My analysis often begin from the higher timeframe and it moves to the lower timeframe.
On the higher timeframe like the monthly timeframe, I identify market trends, and on other timeframe I search for key market levels and also search for entries into the market.
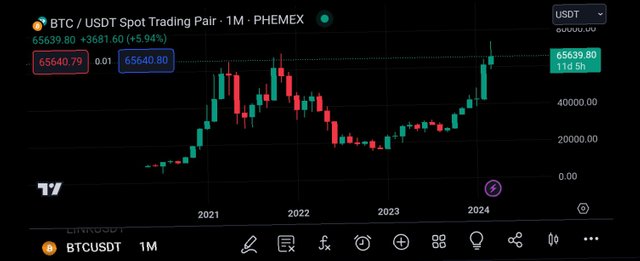
Shown above is the price chart of btcusdt on the monthly timeframe.
And as seen above, there are no noise in the market and as such, it becomes easier for market trend to be detected.
From the screenshot above, we can see that the market is in a bullish trend, as it consists of higher highs and higher lows.
Then for proper analysis, I decided to visit the weekly timeframe.
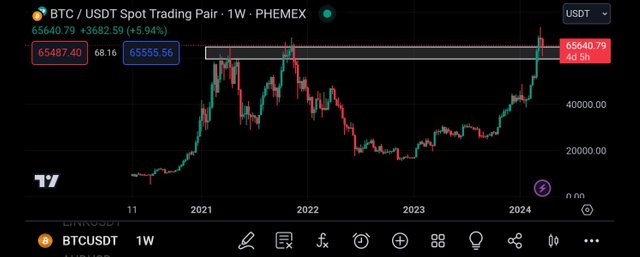
Then I moved to the weekly timeframe as I have earlier stated.
On this timeframe, I can see more market activities as each candle on this timeframe was formed after a period of 1week of market activities.
And on this timeframe, I was able to detect a key level on the price chart.
This level has served well as a resistance level to market price, and now it has been broken by the market price.
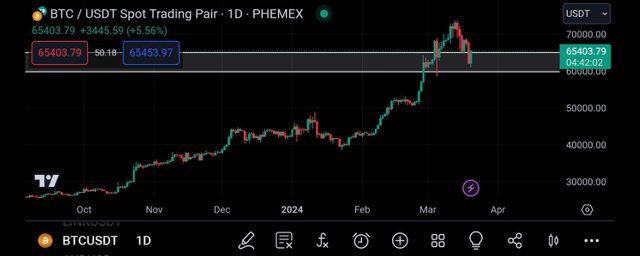
Then I move to the daily timeframe to continue my analysis.
On the daily timeframe, I found many candlestick, more than those found on the higher timeframe.
And also on this timeframe, I noticed that the market has broken the strong resistance level and has retraced to retest this broken level.
It is expected that after the market has retested this level, it will continue it's bullish move.
To gain more market details, I moved to the 4hr timeframe.
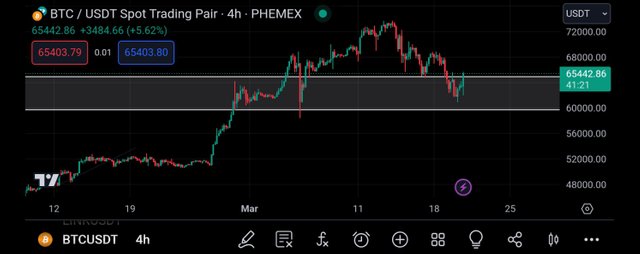
On the 4hr timeframe, there are more noise than the daily timeframe but I remained focused on what I was looking for.
On this timeframe, I can see bullish rejection candles which is enough criteria for me to enter into the market.
From this, I can join the market to the closest resistance level and before doing that, I intend to move to the lower timeframe for more analysis.
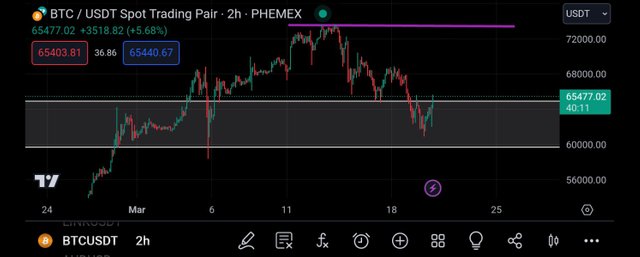
On the 2hr timeframe, my bullish bias became stronger and I intended to enter a buy on the market.
As seen above, there have been several formation of bullish candles and as such, I decided to make use of rsi indicator as a confluence for my analysis.
CONFLUENCE USING RELATIVE STRENGTH INDEX INDICATOR
The relative strength index indicator is an indicator that helps to identify overbought and oversold market.
When a market is spotted to be overbought, it is a bearish trend reversal signal and when it is oversold, it is a bullish trend reversal signal.
An overbought market can be spotted when the rsi crosses above the 80% line and an oversold market is detected when the market crosses below the 20% line.
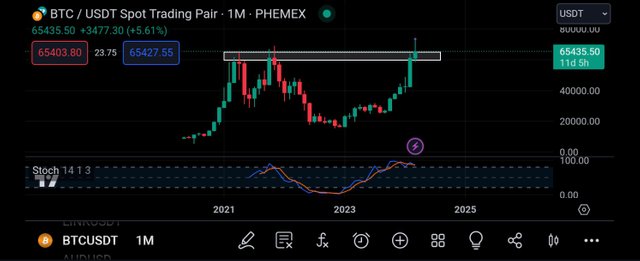
Then I decided to add the rsi indicator to the monthly timeframe.
And as seen above, the rsi is in an overbought region, and this is an indication that the market is about to experience a bearish move.
For more analysis, I moved to the daily timeframe which can be seen on the screenshot below.
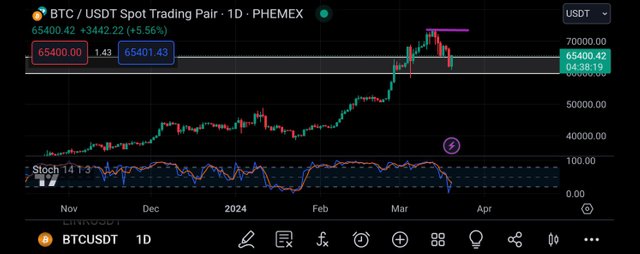
As seen above is the daily timeframe of the pair btcusdt.
And from the screenshot above, we can that the market is being oversold, and this can be confirmed as we see the rsi cross below the 20% line.
And this is known to be a bullish trend reversal signal, and it is in alliance with my analysis using support and resistance.
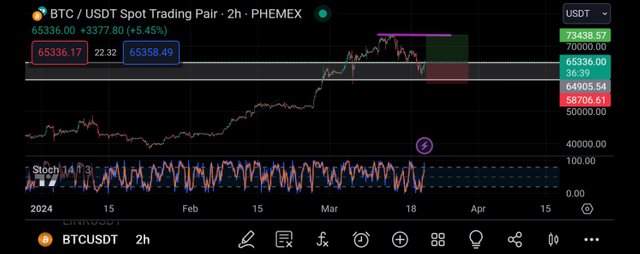
I then moved to the 2hr timeframe in search of an entry into the market.
On this timeframe, I placed my entry in the broken resistance level which is now functioning as a support level.
And then I placed my take profit on the closest resistance level to the market price.
CONCLUSION
Bitcoin is the father of all cryptocurrency and it is the driver of all other altcoins in the cryptomarket.
I have shared my analysis on the market and I expect to see a momentary bearish move.
https://twitter.com/JuecoYoung/status/1770553513619103828
Upvoted! Thank you for supporting witness @jswit.