Top Down Analysis Of ETHUSDT Using Support And Resistance Strategy And RSI Indicator As Confluence

Hello great minds,
It is a great opportunity to come before you all today to share my technical analysis on eth against usdt.
I believe you are all doing perfectly well and are enjoying your activities in the community as you actively promote steemit across various social media platform.
Ethereum is a very big cryptocurrency in the cryptospace and we are well aware of this.
Ethereum happens to be the second most biggest and popular cryptocurrency in the cryptospace.
After Bitcoin which is the driver of all other tokens, ethereum is known to be the next most valuable token, and I am here to share my analysis to it.
ANALYSIS USING SUPPORT AND RESISTANCE STRATEGY
I begin my technical analysis from the higher timeframe, then I descend to the lower timeframe
On the higher timeframe, ideally the monthly timeframe, I seek to determine market trend
The monthly timeframe helps to eliminate market noise from the market and also compress the market to one screen.
And from this, it becomes very easy for the market trend to be predicted.
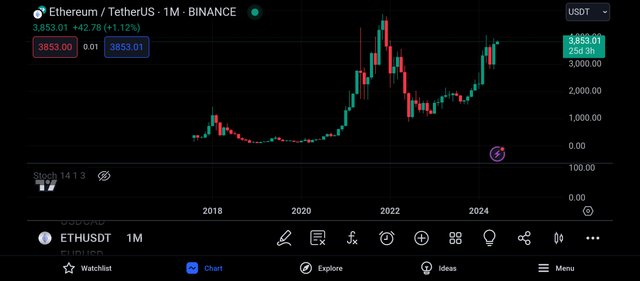
The screenshot above is that of the pair ethusdt on the monthly timeframe.
And as seen above, there are lesser candles on this timeframe and this is as a result of the time it takes for one of this candles to be formed.
On the monthly timeframe, it takes the time period of 1month for each candle to be formed.
And also, it is easy for the overall trend of the market to be detected on this timeframe, as we can see that the market is being bullish.
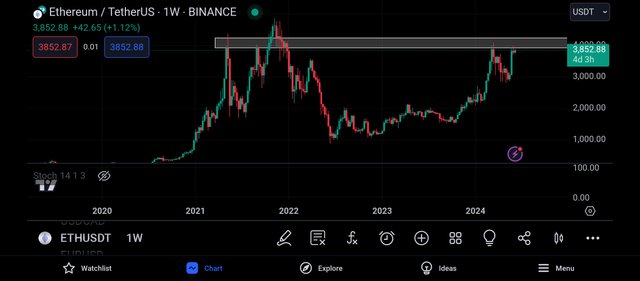
Then I decided to continue my analysis on this timeframe which is the weekly timeframe.
And on this timeframe, I noticed that there are more candlestick than on the monthly timeframe, and this is because the candles on this timeframe is formed within the time period of 1week.
And looking carefully, I was able to spot an important level and this level is functioning as a resistance level to the market price.
And from the screenshot above, we can see that the market has made several touches on this level and has been unable to break above it expect for a false breakout which is as a result if market manipulation.
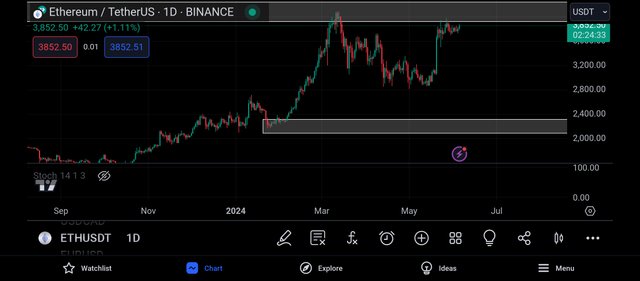
Continuing my analysis, I moved to the daily timeframe and on this timeframe I could see series of market activities.
I could see the bears and bulls as they show their strength in the market by competing on who will have more influence on the market movement.
Also, i was able to spot a key level and this level is functioning as a support level to the market price, and it is expected that whenever the market trades towards this level, it gets rejected to the upward direction.
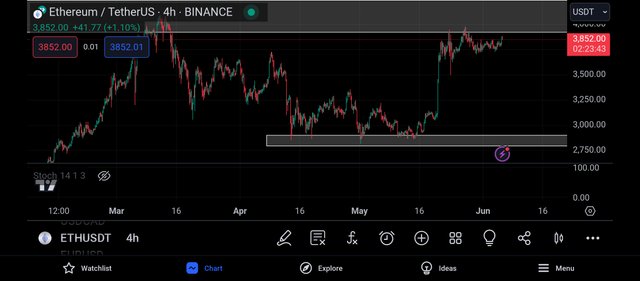
Moving to the 4hr timeframe, I could see lots of noise in the market.
And I could see the market more clearly and I noticed that the market is retracing to retest it's resistance level and when this happens we can expect to see a bearish move of the market price.
With this, my bearish bias of the market is strengthened and I moved to the 2hr timeframe in search of possible entries into the market.
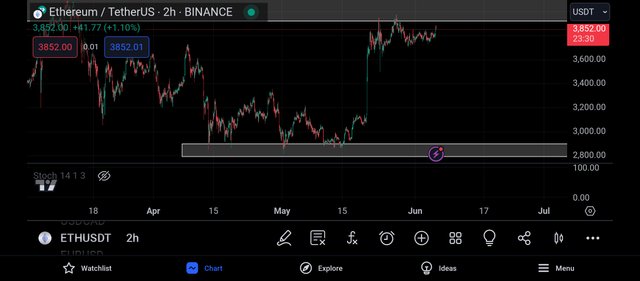
The market structure on the 2hr timeframe is so similar with that on the 4hr timeframe, and as such my bearish bias remains the same.
And in search of a Confluence for my trade, I decided to make use of the relative strength index indicator.
CONFLUENCE USING RELATIVE STRENGTH INDEX INDICATOR
The relative strength index indicator is an indicator that helps to identify overbought and oversold market.
When a market is spotted to be overbought, it is a bearish trend reversal signal and when it is oversold, it is a bullish trend reversal signal.
An overbought market can be spotted when the rsi crosses above the 80% line and an oversold market is detected when the market crosses below the 20% line.
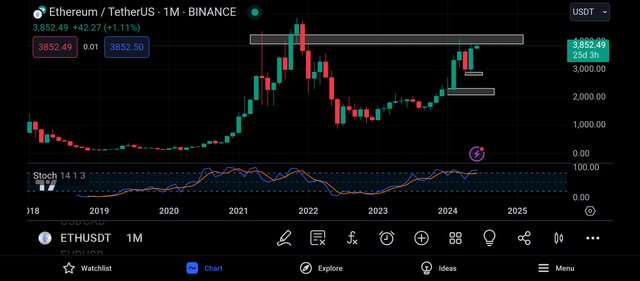
Applying the rsi to the monthly timeframe, I noticed that the monthly timeframe has crossed above its 80% level..
And this is an indication that the market is being overbought and an overbought market indicates a change in strength from the buyers to the sellers.
In simple terms, we can say that an overbought market signals a bearish trend reversal.
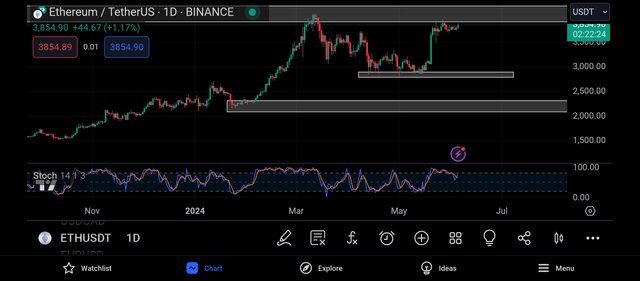
Moving to the daily timeframe, I noticed that the rsi has crossed above its 80% level just as in the monthly timeframe.
And this is an indication that the market is going to be bearish, it implies that we should expect the formation of several bearish candles.
And this is in alliance with my analysis using support and resistance strategy and as such, I decided to move to the 2hr timeframe in search of entry into the market.
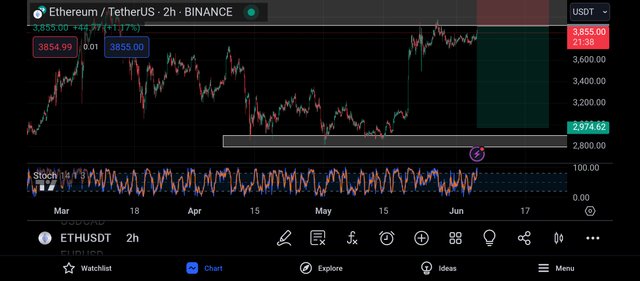
Applying the rsi to the 2hr timeframe, I noticed that the market is also being overbought and it is a signals for bearish trend reversal.
With these confluences, I placed my sell order on the closest resistance level to the market and my take profit was placed on the closest support level to the market.
CONCLUSION
I have shared my analysis on ethusdt beginning from the monthly to the weekly to the daily and to the hourly.
From my analysis, I expect to see a bearish move on ethusdt.
https://x.com/JuecoYoung/status/1798477594675077430
Upvoted! Thank you for supporting witness @jswit.