Top Down Analysis Of ETHUSDT Using Support And Resistance Strategy And RSI Indicator As Confluence

Hello great minds,
It is a great opportunity to come before you all today to share my technical analysis on eth against usdt.
I believe you are all doing perfectly well and are enjoying your activities in the community as you actively promote steemit across various social media platform.
Ethereum is a very big cryptocurrency in the cryptospace and we are well aware of this.
Ethereum happens to be the second most biggest and popular cryptocurrency in the cryptospace.
After Bitcoin which is the driver of all other tokens, ethereum is known to be the next most valuable token, and I am here to share my analysis to it.
ANALYSIS USING SUPPORT AND RESISTANCE STRATEGY
I begin my technical analysis from the higher timeframe, then I descend to the lower timeframe
On the higher timeframe, ideally the monthly timeframe, I seek to determine market trend
The monthly timeframe helps to eliminate market noise from the market and also compress the market to one screen.
And from this, it becomes very easy for the market trend to be predicted.

From the above screenshot which is that of ethusdt on the monthly timeframe.
We can see that it is very easy to detect the market trend and we see the market to be in a bullish phase.
Considering the latest market leg, we can the formation of bullish candles as it consist of higher highs and higher lows.

Then I moved to the weekly timeframe for more market analysis.
And on this timeframe, I can see more candlestick on this chart and this is because the candles here take a lesser time to be formed.
And from this timeframe, I was able to spot a key resistance level, and it is expected that the market get rejected when it gets to this level.
Then I continued my analysis from the lower timeframe.

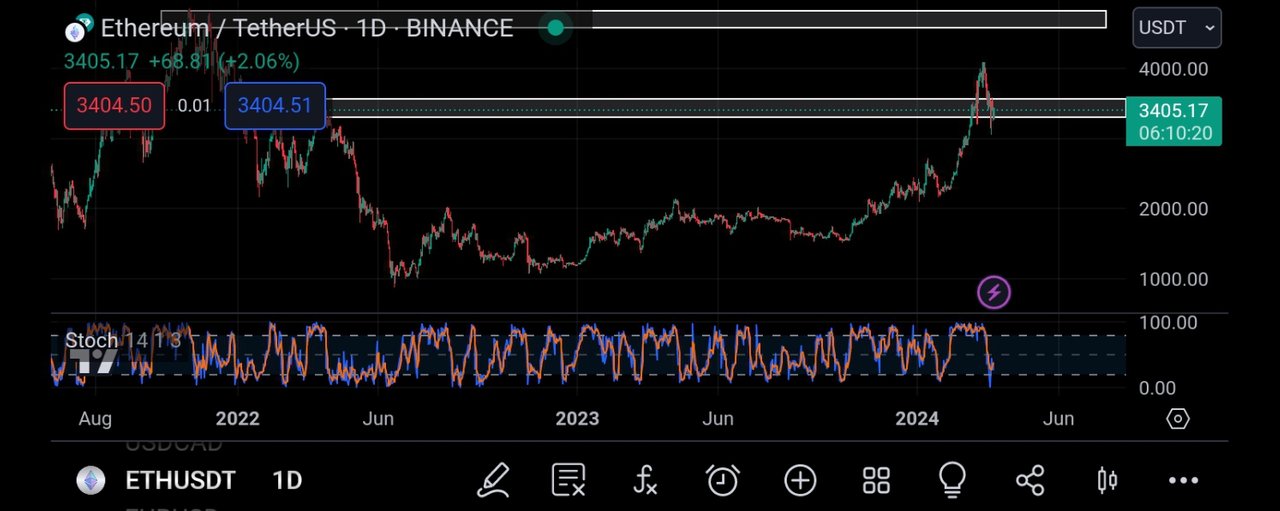
Moving to the daily timeframe, I saw more noise in the market, as there are more candlestick formed.
Then I looked carefully and I was able to detect another key resistance level.
However, this level has been broken and is now functioning as a support level.
And it is expected that when such happens, the market is to retest the broken level before continuing on its normal direction.

Moving to the 4hr timeframe, I can see more candlestick and I can see that the market has retraced to retest the broken level.
See this happen, I expect to see a rejection from the retested level, as it is on this rejection that I will join the market to the upside.
And to see the market more clearly and check out for rejection candles, I decided to visit the 2hr timeframe.

And here, I can see the market more clearly, and I can see the struggle between buyers and sellers to drive price to their preferred direction.
And as I looked carefully, I could see some rejection candles from this level, and this is the confluence I have longed for.
And before entering the trade, I decided to make use of rsi indicator for trading confluence.
CONFLUENCE USING RELATIVE STRENGTH INDEX INDICATOR
The relative strength index indicator is an indicator that helps to identify overbought and oversold market.
When a market is spotted to be overbought, it is a bearish trend reversal signal and when it is oversold, it is a bullish trend reversal signal.
An overbought market can be spotted when the rsi crosses above the 80% line and an oversold market is detected when the market crosses below the 20% line.

Begining with the monthly timeframe, I noticed that the market is being overbought, and an overbought market is signaled when the rsi crosses above the 80% line.
And this is often a sign that the market is about to experience a bearish move, and this is not surprising because the market has just approached a resistance level.
On the daily timeframe, I can see that the market is being oversold, and this is because the rsi has crossed below the 20% line.
And an oversold market is a bearish trend reversal signal, that is, we expect the market to experience a bearish move.
Then I decided to check on the 2hr timeframe for an entry into the market.

On the 2hr timeframe, I decided to enter the market based on the broken resistance.
Setting my entry there, I placed my take profit on the closest valid support, as I expect the market to move in the bullish direction.
CONCLUSION
I have shared my analysis on ethusdt beginning from the monthly to the weekly to the daily and to the hourly.
From my analysis, I expect to see a bullish move on ethusdt.
Upvoted! Thank you for supporting witness @jswit.
https://twitter.com/JuecoYoung/status/1771636866959233499