Topdown Analysis Of BTCUSDT Using Support And Resistance Strategy And RSI Indicator As A Confluence
.png)
Hello great minds,
It is a great opportunity to appear before you all today to share my analysis on bitcoin.
I believe you are all doing perfectly fine and are enjoying your activities in the community as you actively share in steemit promotion across various social media platform.
Bitcoin as we know it, is the father of all other cryptocurrency and it is worth carrying an analysis on, since it is the driver of all other cryptocurrency in the cryptospace.
Today, I will sharing my analysis of btcusdt and I will be beginning from the monthly timeframe.
ANALYSIS USING SUPPORT AND RESISTANCE STRATEGY
My analysis often begin from the higher timeframe and it moves to the lower timeframe.
On the higher timeframe like the monthly timeframe, I identify market trends, and on other timeframe I search for key market levels and also search for entries into the market.
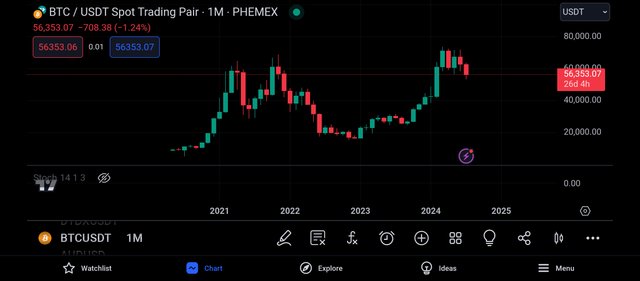
The above screenshot is that of btcusdt on the monthly timeframe as we can all confirm.
And from the above screenshot, we can see that there are less candles on this timeframe, and this is because each candle formed on this timeframe takes an activity period of one month.
Also on this timeframe, we can notice that the market trend is easily identified, and from the screenshot above, we can see that Bitcoin market is bullish overall.
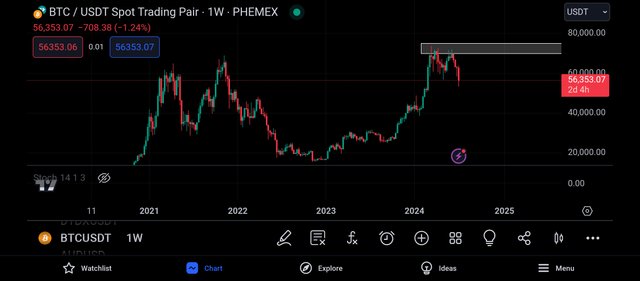
I then continued my analysis by moving to the weekly timeframe and on this timeframe, I could see market more clearly.
I could see the presence of the buyers and sellers as they struggle to drive price to their preferred direction.
Also on this timeframe, I spotted a key level and this level is functioning as a resistance level to the market price, and it is expected that when the market trades towards this level, we see some bearish rejections.
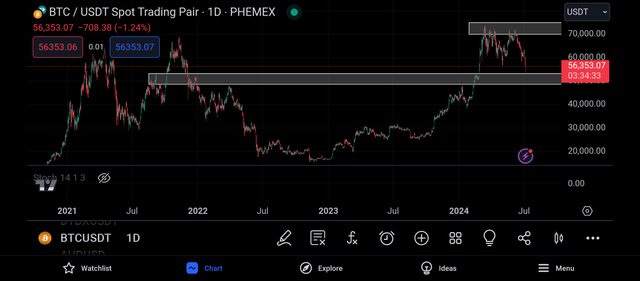
And on the daily timeframe, I could see more market activities, the presence of the buyers and sellers can be seen more clearly.
I was able to identify another important level, and this level is a strong level as it has previously held the market price, and now it will be functioning as a support level.
From the screenshot above, we can see that the market is aggressively approaching this level and when it does, we expect to see a bullish rejection on the market.
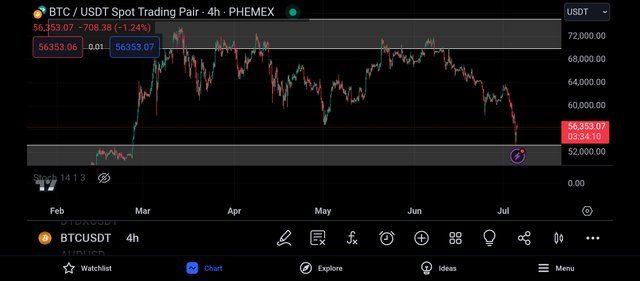
And getting to the 4hr timeframe, I noticed how aggressive the market is , how it is aggressively forming lower lows and lower highs.
And despite the noise in the market, I noticed that the market has traded towards this level and I expect to see a bullish rejection on this market.
This level is a strong level containing a lot of buyers who have the intention of pushing the market higher.
And this analysis have given me a bullish bias of the market, and I decided to move to the 2hr timeframe in search of an entry into the market.
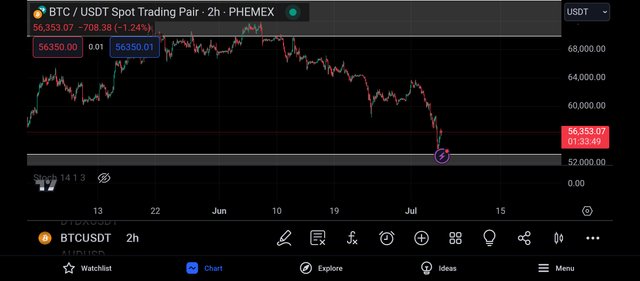
And getting to the 2hr timeframe, I could see that the market has began to be rejected and this is as a result of the buying pressure on that level.
And before I enter into the market, I decided to search for confluence using the rsi indicator, just as seen below.
CONFLUENCE USING RELATIVE STRENGTH INDEX INDICATOR
The relative strength index indicator is an indicator that helps to identify overbought and oversold market.
When a market is spotted to be overbought, it is a bearish trend reversal signal and when it is oversold, it is a bullish trend reversal signal.
An overbought market can be spotted when the rsi crosses above the 80% line and an oversold market is detected when the market crosses below the 20% line.
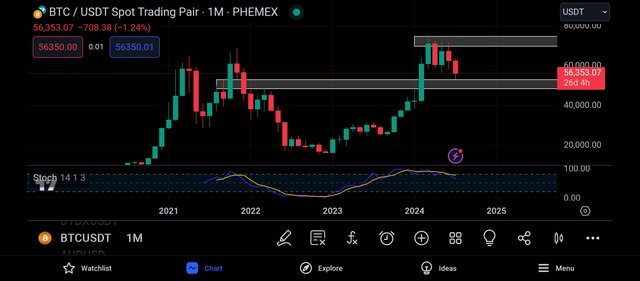
Adding the rsi to the monthly timeframe, I noticed that the rsi has crossed above its 80% line, and this is an indication that the market is being overbought.
An overbought market is one known to signal a bearish trend reversal market.
A market condition that shows the strength of the bears and weakness of the bulls.
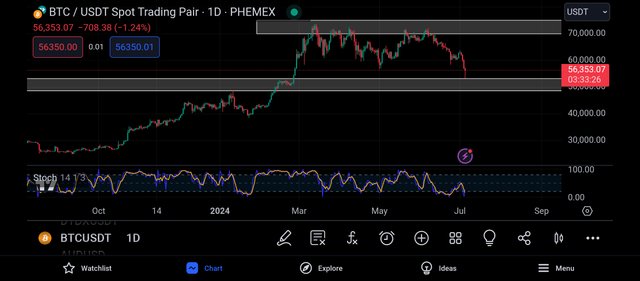
And on the daily timeframe, I noticed that the rsi has crossed below its 20% line.
And this is an indication that the market is being oversold, and as we know it, an oversold market is one that signals a bulllish trend reversal of the market.
That is, we expect to see the buyers taking control of the market.
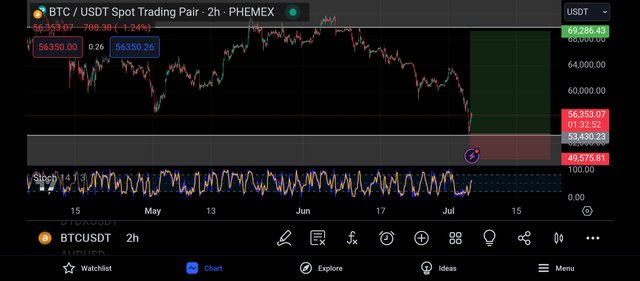
And to take my entry on the market, I proceeded to the 2hr timeframe.
On this timeframe, I also noticed that the market is being oversold and it is a market condition signalling a bullish trend reversal.
And this is in confluence with my analysis using support and resistance strategy.
I then decided to take my entry off the closest support level and my take profit was placed on the market closest resistance level.
CONCLUSION
Bitcoin is the father of all cryptocurrency and it is the driver of all other altcoins in the cryptomarket.
I have shared my analysis on the market and I expect to see a momentary bullish move.
https://x.com/JuecoYoung/status/1809346867441906135
Upvoted! Thank you for supporting witness @jswit.