Topdown Analysis Of SOLUSDT Using Support And Resistance Strategy And RSI Indicator As A Confluence
Hello great minds,
It is a wonderful opportunity to come before you all today to discuss on an issue of great importance in the cryptospace.
I believe you are doing perfectly fine and are enjoying your activities in the community as you actively promote steemit across various social media platform.
Today, I will be sharing my analysis on solusdt, and Solana is a popular token in the cryptospace.
Solana is a very popular project in the cryptospace and has brilliant team who are diligent and have great fundamentals, and as such, I will be sharing my analysis.
Please stay tuned and check out my analysis on this great token.
ANALYSIS USING SUPPORT AND RESISTANCE STRATEGY
My analysis of the cryptomarket often begins from the higher timeframe to the lower timeframe, but I prefer beginning mine from the monthly timeframe.
The monthly timeframe helps me a lot in filtering out noise from the market, and alongside that, it also plays a huge role in the identification of market trends.
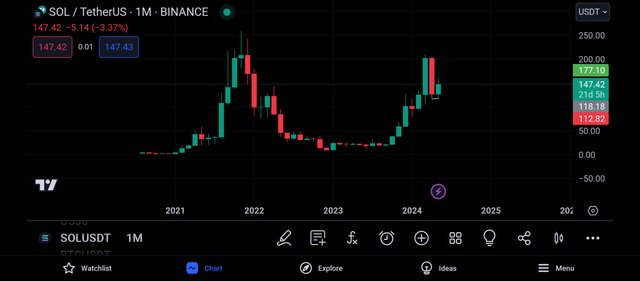
Begining with the monthly timeframe of the pair solusdt, we can see that there are bullish and bearish candles present in the market.
And we can also see that there are lesser candles on this timeframe, and this is because each candle is formed within the space of 1month.
Also on this timeframe, it is easier for the overall market trend to be detected, and we can see that the market is being bullish on its most recent legs.
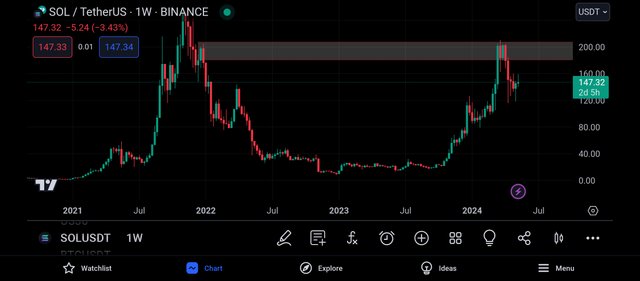
Then I moved to the weekly timeframe for more market analysis.
And on this timeframe, I saw more market activities, I could see more candlestick as the buyers and sellers struggle to push price to their preferred direction.
Also on this timeframe I was able to spot a key level which is functioning as a resistance level to the price chart.
And as seen above, this resistance level has rejected the market price, and we can see this from the formation of bearish candles.
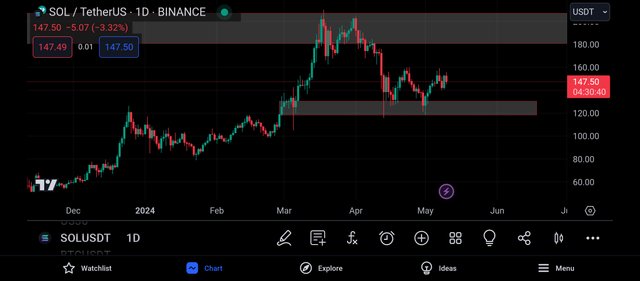
Moving to the daily timeframe, I could see more market activities and also, I could see noise in the market.
Looking carefully, I was able to spot another key level, and this level is functioning as a support level to the market price.
And it is expected that whenever the market gets to this level, the market gets rejected by this level.
And this level is known to be a valid level as it has been severally respected by the market, just as seen above.
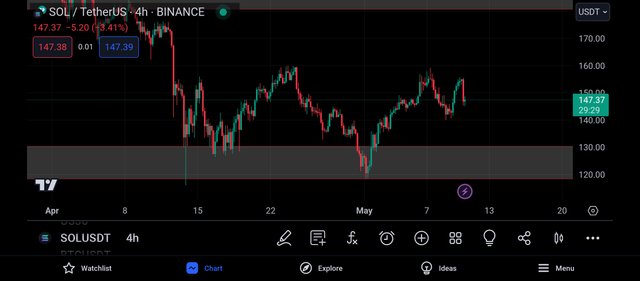
I then continued my analysis by moving to the 4hr timeframe, and on this timeframe, I could see the power thussle between the buyers and sellers in the market.
And on this timeframe, I could see the market movement more clearly, and I noticed that the market is trading towards the support level.
And my expectation is for the market to be rejected when it trades to the support level.
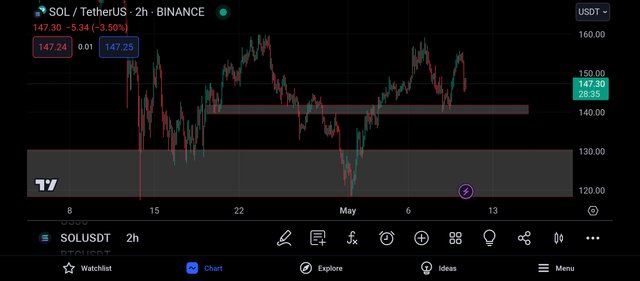
On the 2hr timeframe, there are more candlestick than on the 4hr timeframe.
And also on this timeframe, I was able to spot another level and this level is acting as a support level to the market price.
It's duty is to prevent the sellers from selling the market any further.
And here, my bullish bias for the market became strengthened and I decided to check for trading confluence using the rsi indicator.
CONFLUENCE USING RELATIVE STRENGTH INDEX INDICATOR
The rsi indicator is a technical tool that is used to detect overbought and oversold market.
When the rsi oscillator crosses above the 80% line, the market is said to be overbought and this is known to be a bearish trend reversal signal.
And when the rsi oscilator crosses below the 20% level, the market is said to be oversold.
An oversold market signifies a bullish trend reversal signal, that is , the market is expected to move in the upside direction.
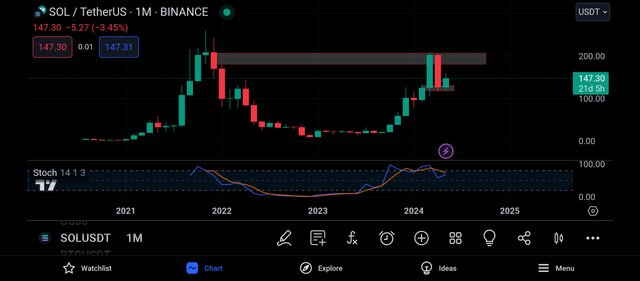
Adding the rsi to the monthly timeframe, I noticed that the rsi has crossed above the 80% line.
And this is an indication that the market is being overbought and an overbought market is seen to be a bearish trend reversal signal.
And this implies that the market is expected to experience a bearish move with time, and with this, I continued my analysis on the daily timeframe.
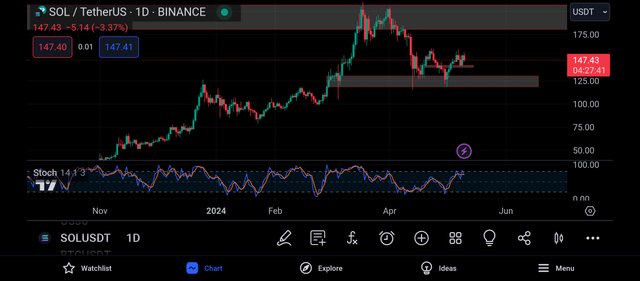
Moving to the daily timeframe, I noticed that the rsi has gotten to it's 80% line, and again this is an indication that the market is being overbought.
And an overbought market often signals a change in strength from the buyers to the sellers and this implies that the market is expected to experience a bearish move .
I then decided to switch to the 2hr timeframe, a timeframe where i search for entry into the market.
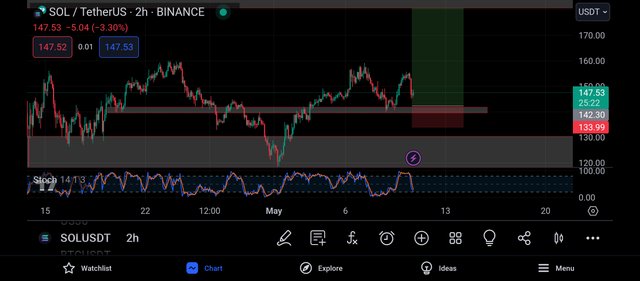
On the 2hr timeframe, I noticed that the market has gotten to its 20% line, and this is an indication that the market is being oversold.
An oversold market signals a bulllish trend reversal, and this is in alliance with my analysis using support and resistance strategy.
And with this, I placed my entry on that closest support level to the market price and my take profit was placed on the closest resistance level to the market price, and this can be confirmed above.
CONCLUSION
Solana is a very good project in the cryptospace but I encourage all to make their own research before investing in any token.
My post should not be taken as a financial advise rather as an educational content.
Upvoted! Thank you for supporting witness @jswit.
https://twitter.com/JuecoYoung/status/1789044177621102719