Topdown Analysis Of BTCUSDT Using Support And Resistance Strategy And RSI Indicator As A Confluence
Hello great minds,
It is a great opportunity to appear before you all today to share my analysis on bitcoin.
I believe you are all doing perfectly fine and are enjoying your activities in the community as you actively share in steemit promotion across various social media platform.
Bitcoin as we know it, is the father of all other cryptocurrency and it is worth carrying an analysis on, since it is the driver of all other cryptocurrency in the cryptospace.
Today, I will sharing my analysis of btcusdt and I will be beginning from the monthly timeframe.
ANALYSIS USING SUPPORT AND RESISTANCE STRATEGY
My analysis often begin from the higher timeframe and it moves to the lower timeframe.
On the higher timeframe like the monthly timeframe, I identify market trends, and on other timeframe I search for key market levels and also search for entries into the market.
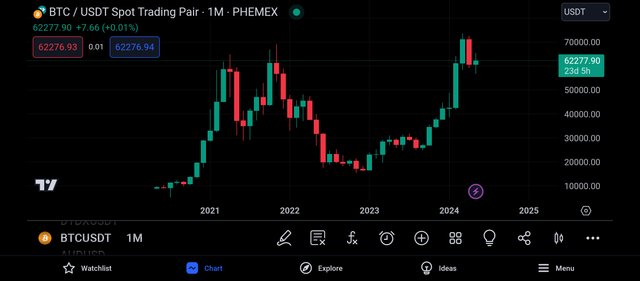
The above screenshot is that of btcusdt on the monthly timeframe as we can all confirm.
And from the above screenshot, we can see that there are less candles on this timeframe, and this is because each candle formed on this timeframe takes an activity period of one month.
Also on this timeframe, we can notice that the market trend is easily identified, and from the screenshot above, we can see that Bitcoin market is bullish overall.
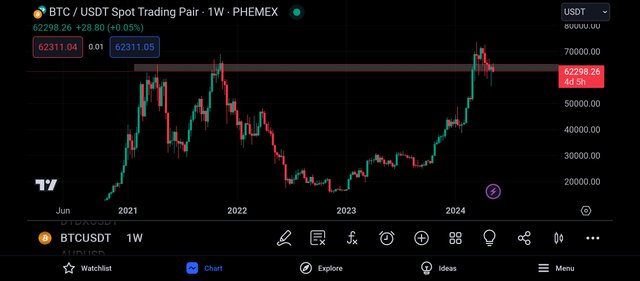
Moving to the weekly timeframe, I could see more market activities, I could see the buyers and sellers struggling to drive price to their preferred direction.
Also on this timeframe, I was able to spot a key market level, a level which is functioning as a resistance level to the price chart.
And it is expected that whenever price trades to this level, it should get rejected, just as it has been doin
g in previous times.
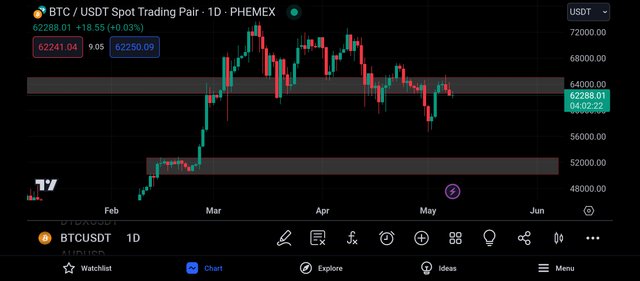
I then decided to continue my analysis on the daily y, and on this timeframe, I could see more market activities than on the weekly timeframe.
Also on this timeframe, I was able to identify another key level on the price chart.
And this level will be functioning as a support level to the price chart, such that when the market trades to this level, it will will be rejected to the upside.
This level can be said to be a valid level because it has previously been respected by market price, and we expect the market to respect it again.
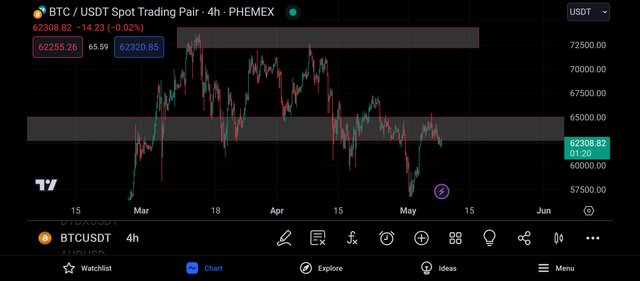
Getting to the 4hr timeframe, I could see lots of market noise, as the bulls and bears are trying to showcase their strengths.
Also on this timeframe, I was able to spot another key level and this level will be functioning as a resistance level to the market price, incase we embark on a bulllish move.
And it is expected that the market gets rejected to the bearish side whenever it trades to this level, just as it has previously been doing.
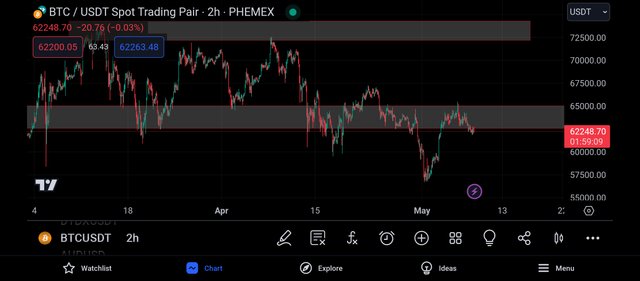
On the 2hr timeframe, I could see the market more clearly, I could clearly see the struggle between the buyers and sellers in the market.
And also, I could see that the bears are taking charge, and this gave me a bearish bias of the market and before entering the market, I decided to search for confluence using relative strength index indicator.
CONFLUENCE USING RELATIVE STRENGTH INDEX INDICATOR
The relative strength index indicator is an indicator that helps to identify overbought and oversold market.
When a market is spotted to be overbought, it is a bearish trend reversal signal and when it is oversold, it is a bullish trend reversal signal.
An overbought market can be spotted when the rsi crosses above the 80% line and an oversold market is detected when the market crosses below the 20% line.
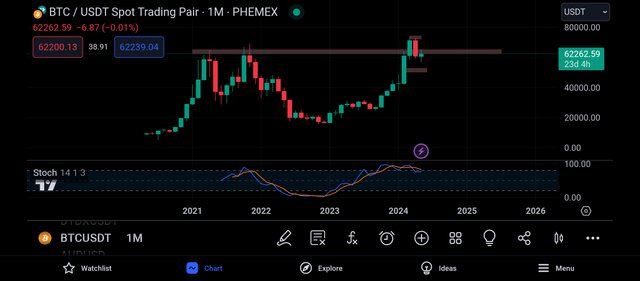
I then decided to add the rsi to the monthly timeframe for a start, and on this timeframe, we can see that the rsi has crossed above its 80% line.
And when this happens, the market is said to be overbought, and an overbought market is understood to give a bearish trend reversal signal.
And this implies that we expect to see the market embark on a bearish move, just as indicated in our analysis using support and resistance strategy.
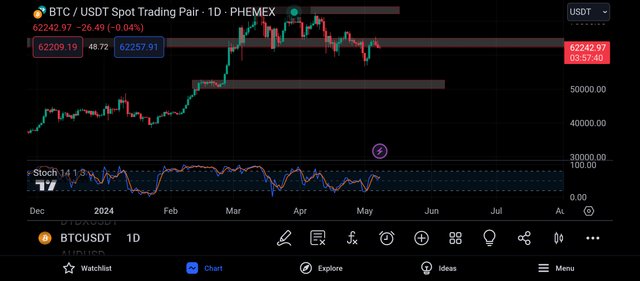
Moving to the daily timeframe, I noticed that the rsi has gotten to its 80% line and this is an indication that the market is being overbought.
An overbought market as we know is expected to be sold, that is the market is expected to embark on a bearish move.
That being the case, I moved to the 2hr timeframe in search of entry into the market.
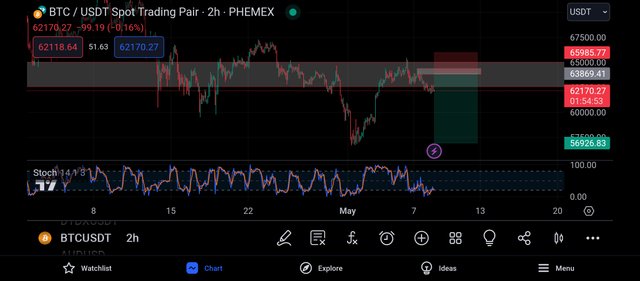
Moving to the 2hr timeframe, I noticed that the market is being oversold, which is an indication that we expect to see a bullish move of the market.
Not withstanding, I placed my entry on the closest resistance level to the market price and my take profit was placed on the closest support level to the market price just as seen above.
CONCLUSION
Bitcoin is the father of all cryptocurrency and it is the driver of all other altcoins in the cryptomarket.
I have shared my analysis on the market and I expect to see a momentary bearish move.
Upvoted! Thank you for supporting witness @jswit.
https://twitter.com/JuecoYoung/status/1788318641596833795