Understanding of Volume Spread Analysis(VSA)
Hello everyone, How are you doing, I welcome you again to my blog in the Steem Alliance community
Today, we will discuss an interesting topic on the platform which will be: Understanding of Volume Spread Analysis(VSA)
- Introduction
The strong method of technical analysis is the volume spread analysis (VSA) which analyzes the relationship between price action, volume, and the spread of the financial market.
To help traders make better, Volume Spread Analysis tends to respect the market pattern more and give signal regarding its activity.
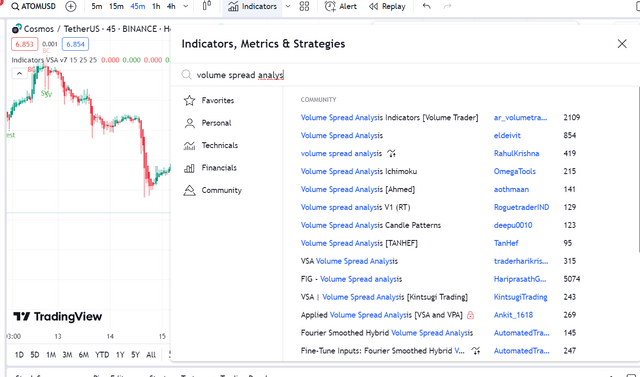
Understanding this tool is quite simple as you can see from the image above, to pick the indicator, simply click on the first one that appears when you search the word "VSA".
Basic Understanding of VSA
Tom Williams was the initial founder of VSA, the basic idea is that market moves are driven by the activities of whales, whose activities we can easily differentiate through the analysis of volume and price spreads, their impact is always visible on the chart.
By taking a trade with the VSA, VSA aims to figure out major areas of strength for how soft or hard a market price movement is.
Breaking Down Of Volume and price Spreads
1 . Volume:
Definition: Volume analysis refers to the quantity of assets or amount of buys or sells traded during a given period.
Interpretation: High-volume candles indicate a strong market, as often as possible by institutional players. Low volume means that there is low participation in the market which is likely due to low liquidity.
2 . VSA Signals:
Effort Versus Result Think of the price spread (result) to the volume (effort). Accepting that the volume is high, but still, the spread is wide, it shows anticipated supply is coming, indicating a market strength.
3 . No Demand/No Supply: Low volume on a tight spread-up candle shows a lack of market makers' interest in that particular pair, indicating an anticipated weakness.
Trading with VSA Strategy
1 . Differentiate between Market Phases:
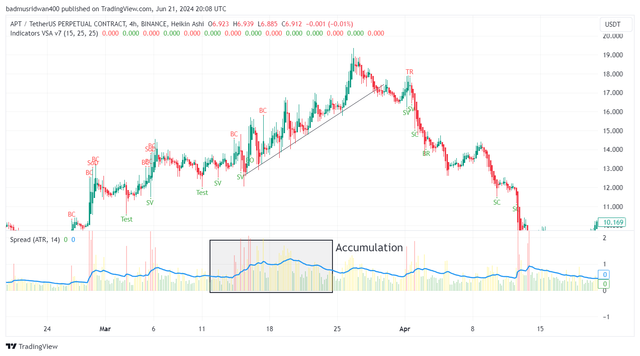
Accumulation: After a downtrend, search for accumulation signs, like where there is less spread on the indicator, and we have more down candles with low volume followed by a big candle bar with high volume.
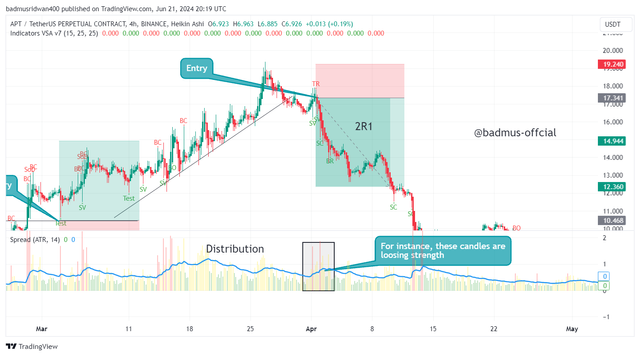
Distribution: In the distribution phase, search for signs of distribution after a massive uptrend which is usually expected anyway, for instance, in a scenario when there is a high-volume bars followed by low-volume bars.
- Signals for Trade Entry:
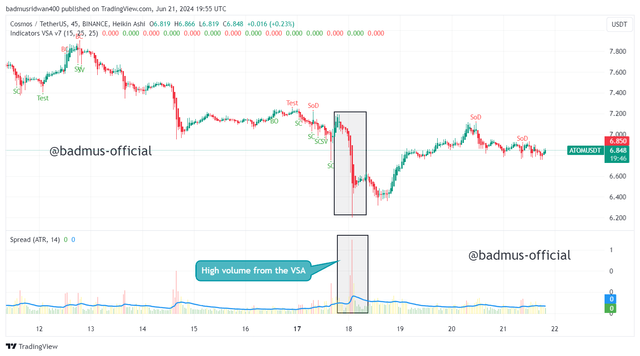
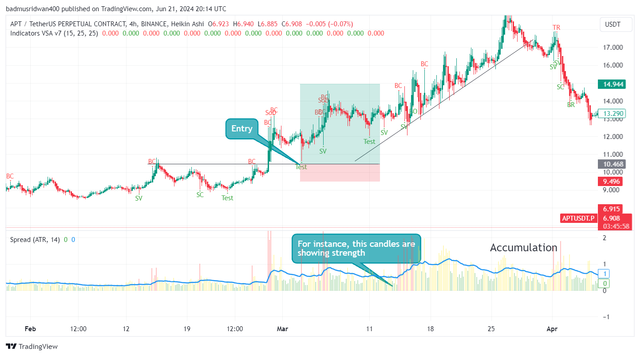
Strength in a Downtrend: When you see movements of restriction in a downtrend, for example, a high volume spread down bars, which shows that supply has stopped and sellers are losing their leverage, enter long positions.
Weakness in the Uptrend: Enter short positions when you see signs of weakness in an uptrend, for instance, high volume thin spread up bars, showing a lack of buyer interest.
Volume Spread Analysis (VSA) offers a simple method for managing and understanding the market area parts with price action by separating the relationship between volume and price spreads.
Traders can gain knowledge of the market's basic price movement power by focusing on volume, price spread, and basic VSA signals.
' NB: This post concerns instruction, not speculation exhortation. Computerized resource costs are dependent upon future developments. All types of crypto speculation have a high gamble. I'm not a monetary counselor, prior to rushing to make any judgment calls in this matter kindly do all necessary investigation and counsel a monetary consultant
Upvoted! Thank you for supporting witness @jswit.
https://x.com/_bhardmorse/status/1804251735239676359
Note:- ✅
Regards,
@jueco
Thanks for the review boss