Understanding Keltner Channels : Combined Technical Analysis
Hello everyone, How are you doing, I welcome you again to my blog in the Steem Alliance community.
Today, we will discuss an interesting topic on the platform which will be: Understanding Keltner Channels
- Introduction
Keltner Channels is a significant technical analysis tool that can help traders spot potential buying and selling opportunities in the trading market.
They are simply made up of an Exponential Moving Average (EMA) and ATR-based bands that measure market volatility.
Major Components
1 . Exponential Moving Average (EMA): Typically a 20-period EMA is used to smooth out price data.
2 . Average True Range (ATR): Calculates volatility over 10 or 14 periods.
3 . Upper Channel Line is calculated as EMA + (Multiplier * ATR).
The normal multiplier is two, regardless, it can be changed depending on market conditions.
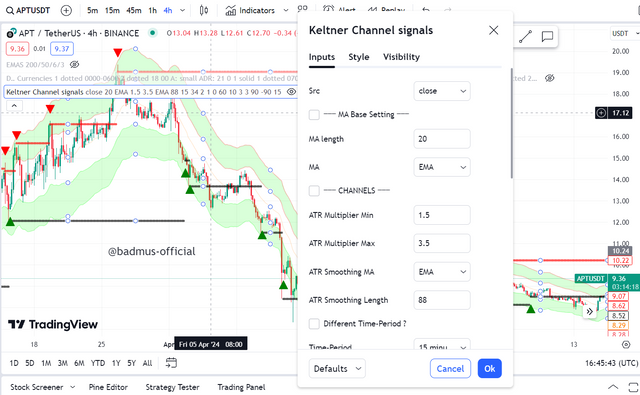
Creating a Keltner Channel Indicator
Step-by-Step Guidelines:
step1 - Calculate the Exponential Moving Average (EMA):
Choose a timeframe (e.g., 20 days).
Calculate the EMA with the accurate period you wanted
Calculate the EMA using the asset's closing values.
step 2. - Calculate the Average True Range (ATR):
Select a timeframe (e.g., 10 or 14 days).
Calculate the True Range (TR) for each period.
ATR is the TR's moving average over the given period.
setp3. - Determine the Upper and Lower Channels:
Upper Channel Line = (EMA + Multiplier * ATR)
Lower Channel Line = (EMA - Multiplier * ATR)
Practical Calculation:
Using a 20-period EMA and a 10-period ATR with a multiplier of two:
EMA = $100 - ATR = $2 - Upper Channel Line = $100 + (2 * 2.2) = $104
Lower Channel Line: $100 - (2 * $2) = $96
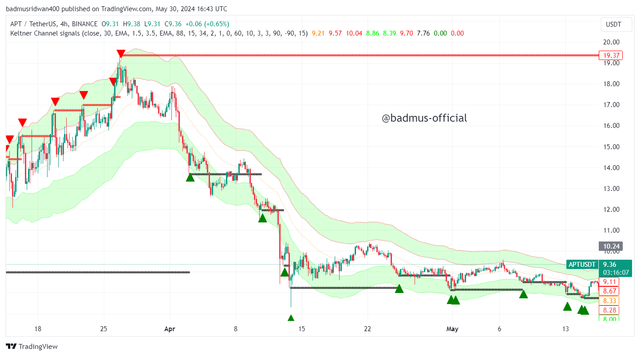
Simple Interpretation of Keltner Channels
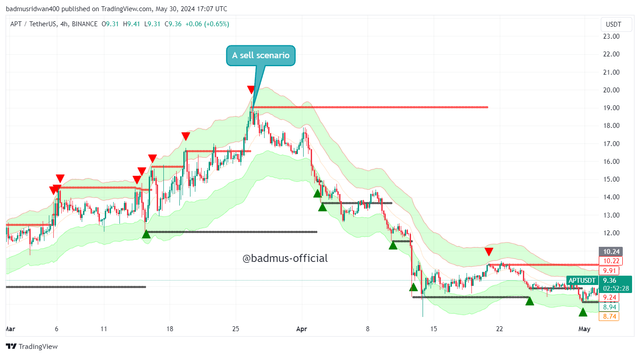
Price Above the Upper Channel Line: Indicates a potential overbought signal, a potential sell.
Price below the Lower Channel Line: Indicates a possible oversold situation, and a potential buy.
- Price Between the Channels: This indicates normal trading conditions, with the EMA serving as support or resistance.
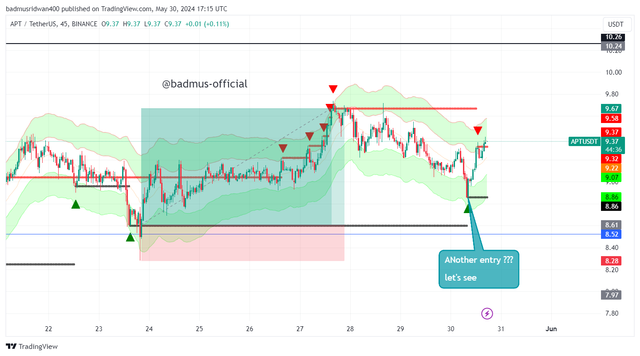
Keltner Channels is a flexible trading strategy that can be used to identify overbought and oversold conditions, confirm trends, and identify breakouts.
At the same time, combining Keltner Channels with additional indicators might also help to improve your trading strategy and decision-making, always use proper risk management to protect your trades, and remember that no indicator is 100% accurate.
' NB: This post concerns education, not investment advice. Digital asset prices are subject to change. All forms of crypto investment have a high risk. I am not a financial advisor, before jumping to any conclusions in this matter please do your research and consult a financial advisor
https://x.com/_bhardmorse/status/1796230892207358191
Upvoted! Thank you for supporting witness @jswit.
Note:- ✅
Regards,
@jueco