A Detailed Understanding to Market Breadth Indicators
Hello everyone, How are you doing, I welcome you again to my blog in the Steem Alliance community.
Today, we will discuss an interesting topic on the platform which will be: Understanding to Market Breadth Indicators
- Introduction
Market Indicator indicator is another important indicator we will talk about today in our journey to technical analysis knowledge.
This is an important technical indicator that helps to examine the general course and strength of the market, These indicators give insight into the basic strengths or weakness of a market pattern by analyzing the number of buyers and sellers in a particular market pair.
Understanding the market breadth can help traders measure the strength of the market developments and be well-positioned ahead of any sudden movement.
Understanding Market Breadth
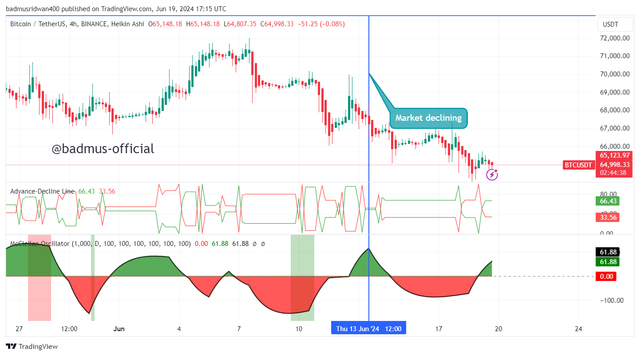
Market breadth simply refers to the analysis of the current market move, It goes beyond just the market price, and it helps to show whether or not a market pattern is strong or maybe a reversal is coming soon which we shall see the interpretation below.
As we have seen from the indicator, a strong market breadth simply means that the current trend is strong and no reversal is coming soon, but in any case, when we see the breadth losing its composure, that means a reversal is near.
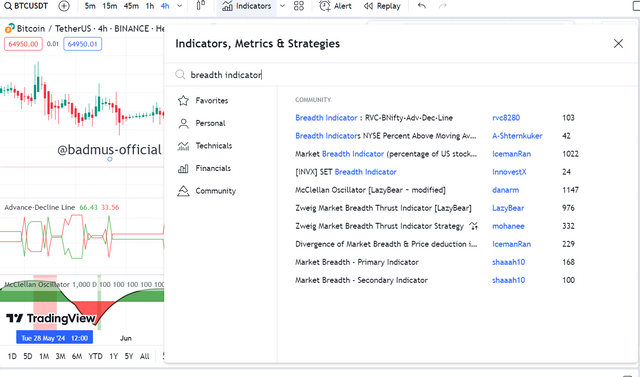
Major Keys To Focus on In Breadth Indicators
We shall then discuss some major keys which are normally used to analyze market situations especially when using the breadth indicator:
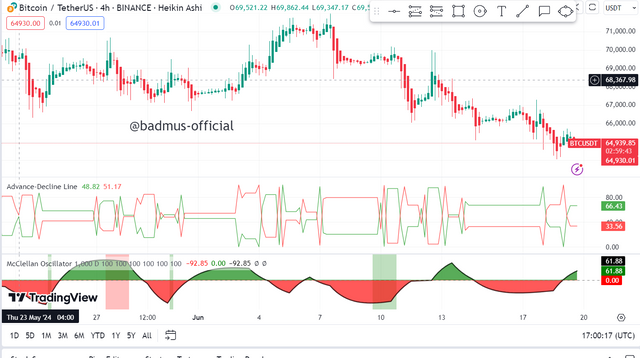
1 . Advance-Decline Line (A/D Line):
Definition: The A/D Line Line combined difference between the amount of rising market and falling market.
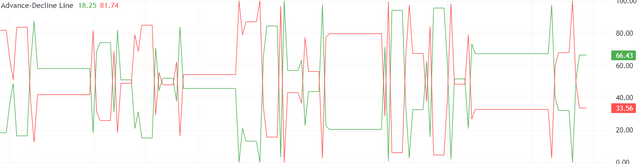
Interpretation: A rising A/D Line shows wide market movement in an uptrend, while a falling A/D Line shows weak market movement.
2 . Advance-Decline Ratio (A/D Ratio):
Definition: The A/D Ratio compares the number of rising stocks to the number of falling stocks ( in any case you might be confused about why we using the word "stock", it basically means market as well)
Calculation: A/D Ratio = Number of Rising Markets / Number of Falling Markets.
Interpretation: A ratio above 0 shows that markets are rising rather than falling, while a ratio under 0 indicates that prices are falling.
Using Breadth Indicator in Trading Decisions
Market breadth indicators give a powerful analysis that can easily upgrade our trading experience, this is the best way to apply breadth indicators to trading:
1 . Confirming Trends:
We can utilize the market breadth indicator to affirm the strength of a market structure. A rising A/D Line or positive McClellan Oscillator flags a bullish trend, while a falling A/D Line or red McClellan Oscillator flags a bearish pattern.
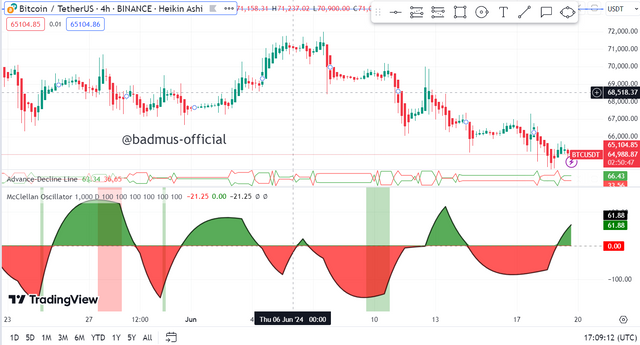
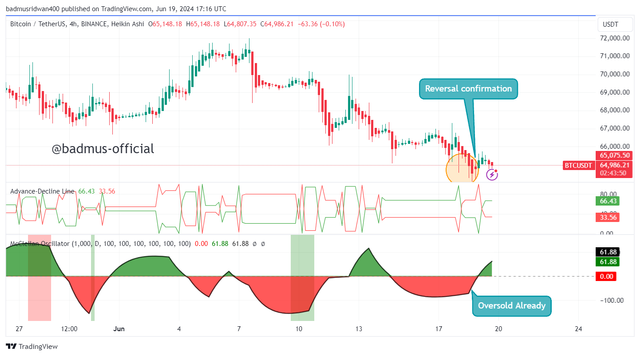
2 . Identifying Overbought/Oversold Conditions:
The Red and green oscillators can help identify overbought or oversold conditions. A sudden big number of greens could indicate overbought conditions, while the counterpart could indicate an oversold condition as well.
3 . Timing Entries and Exits:
The Breadth Indicator can assist with timing market entries and exits, For example, when we see a red oscillator rising in the McClellan Oscillator, this could assist with showing a legit entry point, while when see a green oscillator falling crossover could show an opportunity to exit as quickly as possible.
Conclusion
Market breadth indicators are a fundamental tool for breaking down the overall strength and direction of the market, by applying key breadth indicators like the Advance-Decline Line, and McClellan Oscillator, traders and investors can have a further understanding of market movement and have the correct insight into their trading choices.
Whether confirming patterns or recognizing an overbought/oversold condition, the market breadth indicator is just like an automatic upgrade machine that helps us to examine the capacity of the current market condition.
' NB: This post concerns education, not investment advice. Digital asset prices are subject to change. All forms of crypto investment have a high risk. I am not a financial advisor, before jumping to any conclusions in this matter please do your research and consult a financial advisor
Upvoted! Thank you for supporting witness @jswit.
https://x.com/_bhardmorse/status/1803483112782921764
Note:- ✅
Regards,
@theentertainer
Thanks ser