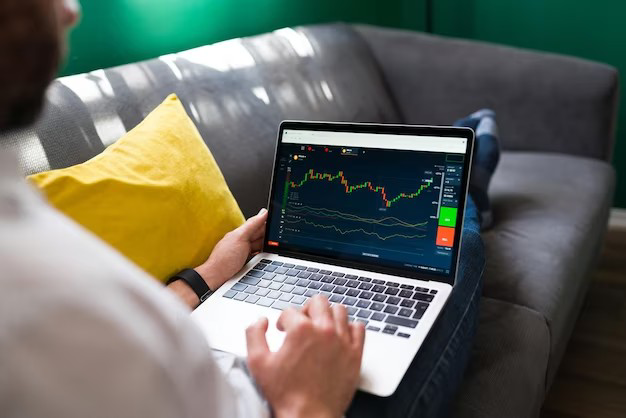
All the traders that are doing the work of trading use these charts for trading because from this chart they check the price and also check the fluctuation in price of any cryptocurrency.
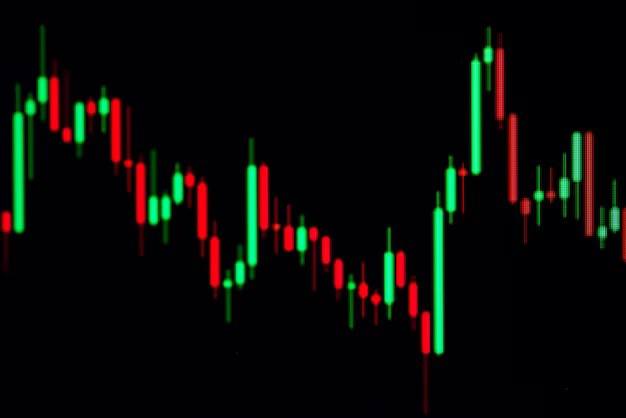
These charts know as candlestick charts because they have the rows like candle and that's why they know as candlestick chart.
The work of these candlestick chart is bit difficult and it needs a proper research for checking or reading them.The work of these charts is that firstly open the coin that we want to check.
After opening it on trading exchange then open the coin price and below it shows the chart of the coin and basically this chart showing the actual price of coin.
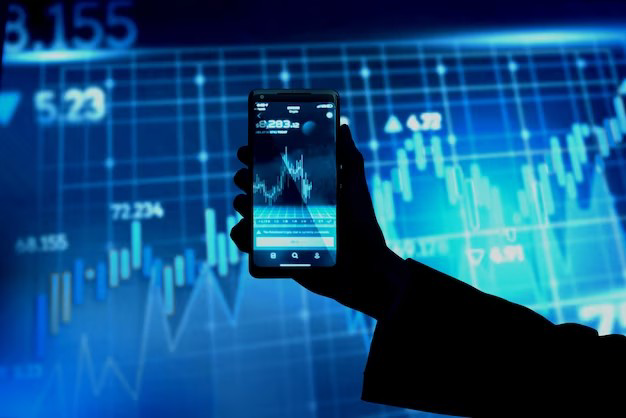
First of all check the highest price of coin with a particular timeframe and after checking that check the highest price that has been recorded.
Then check the lowest price of coin in a particular timeframe and then check the lowest price recorded on the chart and then check the actual price.
The most important thing that how to read candlestick chart is the important thing and many of the traders think that it's easy to read candlestick chart than other bar and lines.
Candlestick chart provide a lines of different colors and these lines are the way to read candlestick chart and these lines shows all the prices of a coin.
And after checking and calculating all the prices of a coin that has been given by the lines of candlestick chart then we can read it easily and that's best way to read them.
Thier are two specific lines and one is green and other is read and if the line is green so it mean the price is higher than actual price and if line is red then it mean price is lower than actual price.
In this post i have shared about the candlestick chart that the traders used for trading and I also explained how they work and how to read them in crypto trading.
If anyone want to read them and want to do trading then the user has to also do own research and then do trading and i hope this will be very beneficial for all of us.
@azmat545

Upvoted! Thank you for supporting witness @jswit.
Hello @azmat545,
Are you a crypto trader or you are publishing what you watched on YouTube?
Your explanation to this is very shallow and you have not given any precise way to read candlestick chart in cryptocurrency.
Please make your post more detailed
I read his content. Not satisfied content. In overall post just write the green and red candle.
There many things in candle sticks like Wick , body , timeframe etc.
Cc. @jueco , @alsarzilsiam
ok, note it.