Update #73: Writing Expedition ✍️Wednesdays: Crypto/technology
Hi Steemians,
It's another day of the week and I'm delighted to participate in this contest today organized by @steemkidss which talks about Update #73: Writing Expedition ✍️Wednesdays: Crypto/technologyI will be making my entry below so read through it and drop your valuable comment as it will be appreciated.

It's Wednesday and a day to share my knowledge on the writing expedition contest for the week. Every Wednesday we talk about cryptocurrency or technology and today I would also like to discuss crypto analysis where we see the behavior of STEEMUSDT.
Over the past few months, I have been learning and studying crypto trading and how one can become a profitable trader in the space. I do not have sufficient knowledge to trade hence I always try to learn from articles written by other people also I learn much about risk management as that is needed to keep me longer in the market.
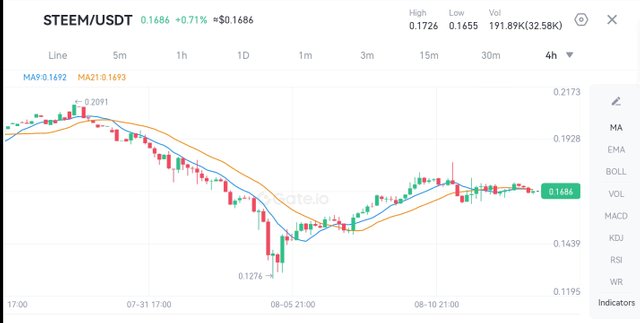
Let's consider the chart above. I will want to explain what the market in the above chart is all about. From the chart above, we have employed the moving average indicator which helps to spot an opportunity to buy and sell the market. There are two MA lines and anytime one crosses the other, we see the price of the asset going in a certain direction.
If the Indicator is seen below the price chart, it is evidence that the market is going in an upward direction and during that phase, we need to long the market at that time. Also when the indicator is seen above the price chart it is a signal that we need to sell the market.
The chart above shows that the price is seen above the price chart and from the chart we can see that the market is going downward and for that reason, it is expected that we sell or short the market.
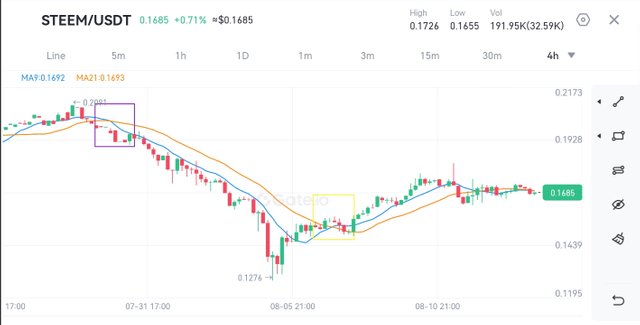
Also going further, I decided to spot regions where the trend changed due to the crossing of the moving average line for buying and selling opportunities respectively. The chart below shows that.
From the chart above, you can see that the purple rectangle is used to mark the space where the MA crossed each other and was seen above the chart and that indicated that the price is coming downward. So a sales opportunity is what everyone should take.
Also from the chart you can see another rectangle which is yellow in colour. There was also a crossing in the lines which brought the indicator below the price chart indicating that the market will be going upward. With these you can go ahead to enter a buy order in the market.
In summary, the MA indicator is used to know when to buy or sell your assets and also when you can exit your trade when you are seeing another crossing which implies another direction.
I want to invite @elagusella, @enyddy, and @hafsasaadat90 to also join the contest in this community today.
Thank you, friend!


I'm @steem.history, who is steem witness.
Thank you for witnessvoting for me.
please click it!
(Go to https://steemit.com/~witnesses and type fbslo at the bottom of the page)
The weight is reduced because of the lack of Voting Power. If you vote for me as a witness, you can get my little vote.
Upvoted! Thank you for supporting witness @jswit.
https://x.com/kuzboy82334/status/1823648111039762547
This post has been upvoted by @italygame witness curation trail
If you like our work and want to support us, please consider to approve our witness
Come and visit Italy Community
Hi @kuzboy,
my name is @ilnegro and I voted your post using steem-fanbase.com.
Come and visit Italy Community
Terimakasih telah mengundang saya. Sukses untuk kontesnya
Nice post bro I really learned a lot from it