Update #68: Writing Expedition ✍️ Wednesdays: Crypto/technology
Hi Steemians,
It's another day of the week and I'm delighted to participate in this contest today organized by @steemkidss which talks about Crypto/technology. I will be making my entry below so read through it and drop your valuable comment as it will be appreciated.
Today I want us to look at two major things associated with cryptocurrency i.e the candles and the indicators. In crypto market, there are basically two colour of candlesticks which tells us if the market is in an uptrend or downtrend. So let's discuss them differently below.
The green candlesticks: Whenever you see the market having the green candlesticks, you will notice that the market is going upward which mean that the market is in an uptrend direction.
Traders who trade crypto asset at this moment always look for an opportunity to long the market. As you may have known, when the market is going upward and your prediction is that the market should go up, then you will be earning profits because your prediction is correct.
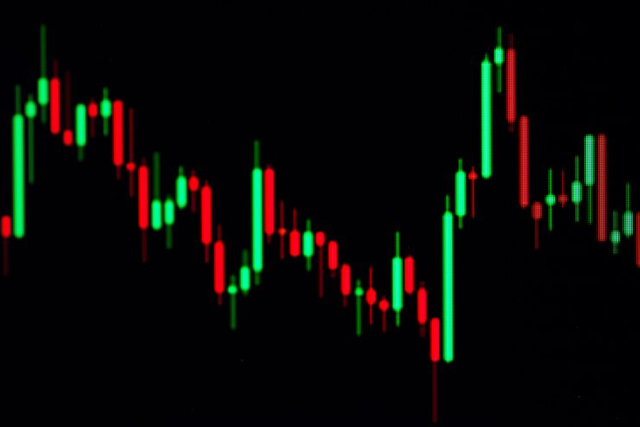
If you predicted that the price should go downward when the market is going up forming more green candles then you will loss your money. So the green candle indicates that the market is going upward and for you to trade successfully you must always trade in the direction of the trend.
| Candlesticks |
|---|
The red candlesticks: Whenever you see the market having the red candlesticks, you will notice that the market is going downward which mean that the market is in a downtrend direction.
Traders who trade crypto asset at this moment always look for an opportunity to short the market. As you may have known, when the market is going downward and your prediction is that the market should go down, then you will be earning profits because your prediction is correct.
If you predicted that the price should go upward when the market is going down forming more red candles then you will loss your money. So the red candle indicates that the market is going downward and for you to trade successfully you must always trade in the direction of the trend.
| Indicators on chart |
|---|
From the image below you will notice the indicator in the chart of the pair of cryptocurrency. From my observation that indicator is a Moving Avearage indicator. So let's talk about the moving avearage and how it works.
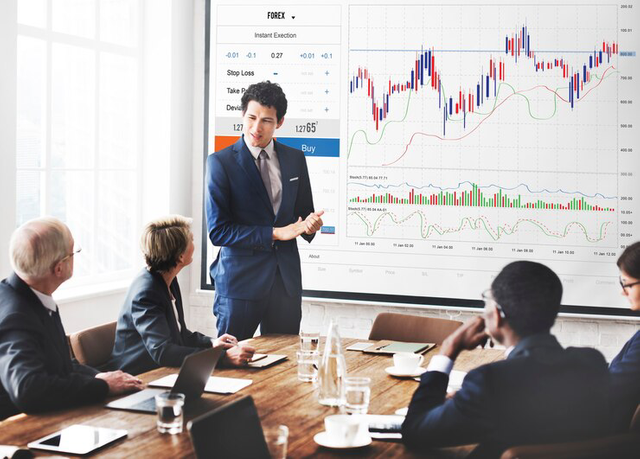
When using the moving average indicator, there are always one or more line on the price chart. Ideally when the moving average line is below the price chart acting as a dynamic support level to the market, it means that the market is in an uptrend movement. Now if you notice this, you are supposed to long the market as a trader.
Similarly, when the indicator is above the price chart acting as a dynamic resistance to the price chart, it means that the asset is in a downtrend. Now hen you notice this, you are supposed to short the market as a trader.
So the indicator helps traders to know which directions to trade their assets. With the placement of the indicator you will know the trend direction and you can then go ahead to trade in the direction of the trend and that is the work of the moving average indicator.
Here I will want to invite a few friends to also join the contest and share their entries as well. I invite @emmy01, @adachukwu and @saintkelvin17 to also share their participation in this week writing expedition contest.
Thank you, friend!


I'm @steem.history, who is steem witness.
Thank you for witnessvoting for me.
please click it!
(Go to https://steemit.com/~witnesses and type fbslo at the bottom of the page)
The weight is reduced because of the lack of Voting Power. If you vote for me as a witness, you can get my little vote.
Upvoted! Thank you for supporting witness @jswit.
https://x.com/kuzboy82334/status/1810933056422752525
TEAM 2
Congratulations! This post has been voted through steemcurator04. We support quality posts, good comments anywhere and any tags.