[Technical Analysis] XRP/USD Market February 02, 2024
Hey Guys..!!
Meet again with me Wahyu Nahrul, This time I want to make a brief technical analysis of a cryptocurrency chart, the analysis I made is based on my experience and knowledge.
.png)
Alright, let's get straight into the discussion, Happy reading!!

Ripple (XRP) Analysis
Today, February 02, 2024, I will try to analyze the price movement of Ripple technically.
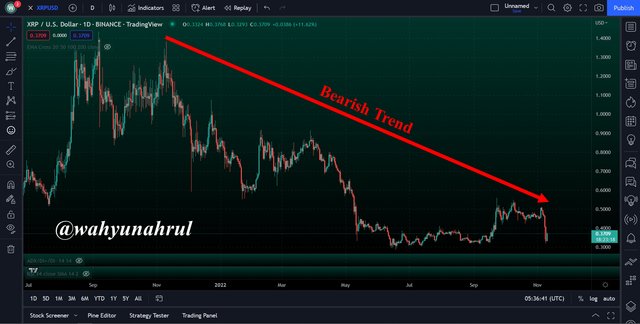
If we look at the price movement of XRP in general, we can see that XRP is in a very deep bearish phase. We can see this in the XRP price movement pattern in the chart above where the candlestick tends to move downwards if we look closely.
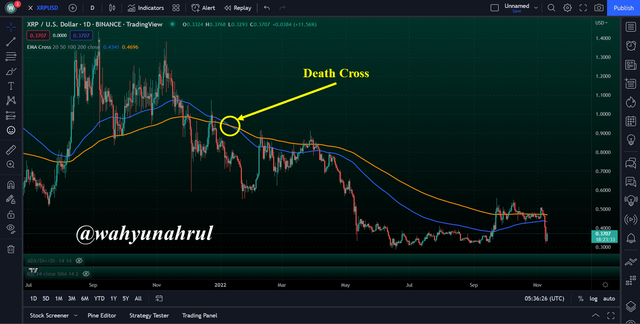
This is confirmed by the EMA Indicator with a Death Cross occurring between the 100 EMA and 200 EMA.
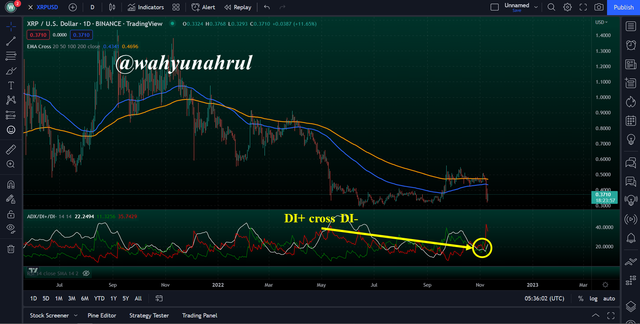
Further confirmation was also given by the ADX indicator with the presence of a cross between the two DI lines where the DI- the line moved above the DI+ line.
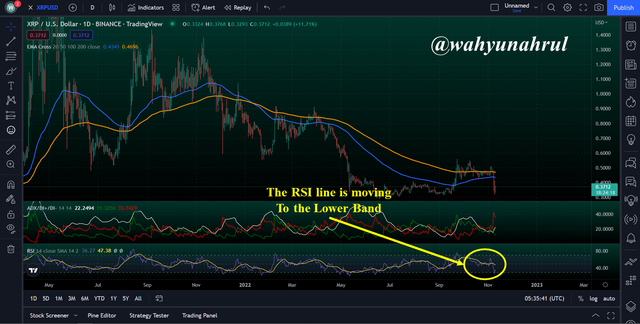
Not to forget, the RSI indicator shows that there is an oversold phase in the XRP/USD market, we can prove this by moving the RSI line below the Lower Band which is the lower limit of the RSI indicator.

Disclaimer:
Upvoted! Thank you for supporting witness @jswit.