Crypto Academy Week 3 Homework Post for (stream4u)
Hello Steemit Crypto Academy Community,
I am about to complete my last course assignment this week. Course professor @stream4u. It is a very challenging and instructive course, so I reserved it for the last course.
Kursun konusu: ''| What is Chart Patterns? | Price Breakout - Continuation Patterns - Reversal Patterns | STOPLOSS.''
I want to complete my homework with the questions asked by the professor.
What Is A Chart Pattern? Explain with Candlestick Charts.
After people trade on the stock markets, a chart is created in which the price values of the assets are displayed. Here we call the resulting image the graphic model. Like the bitcoin chart model for example. Chart models can belong to very different time zones. We learned in our previous lesson.
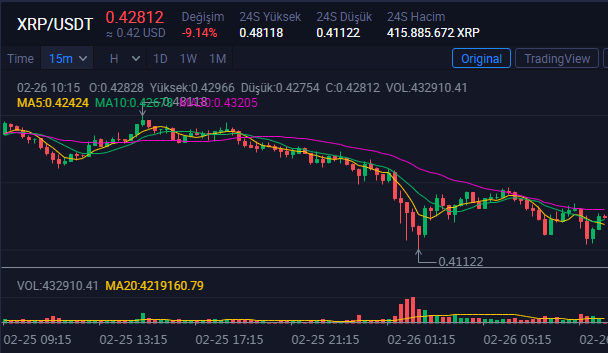
(15-minute chart pattern of XRP / USDT - Huobi.com)
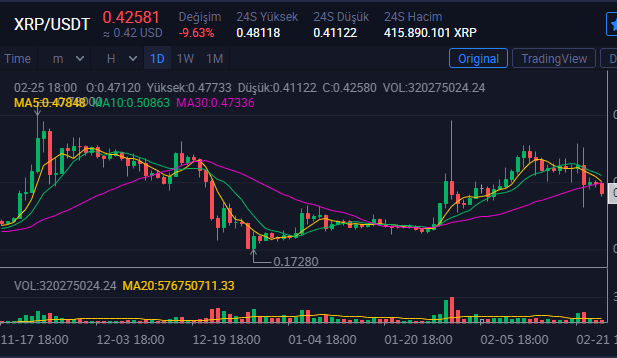
(1-day chart pattern of XRP / USDT - Huobi.com)
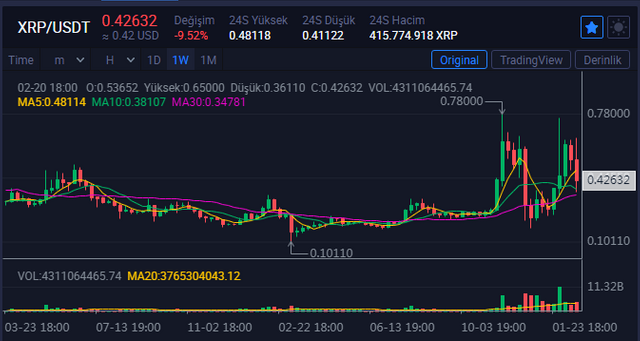
(1-week chart pattern of XRP / USDT)
Price movements create charts for various time frames. These can be 1 minute, 5 minutes, 15 minutes, 30 minutes, 1 hour, 4 hours, 1 day, 1 week, 1 month or more. Chart patterns traders send buy and sell signals. Traders also make their moves by studying different time zones.
The chart patterns feature red and green candlesticks, as well as the support and resistance zones. In the region where the support zone is, it is the region where it is difficult for the asset price to go further down. The resistance zone is also the zone where it is difficult for the asset price to move up further. There can be multiple support and resistance zones in a chart pattern.
What Is A Price Breakout? Explain with Candlestick Charts and mention the price levels.
We have mentioned that there are many support and resistance zones in the chart patterns. We called the area where it is difficult for the asset price to go down, the support zone. We also called the zone of resistance where it is difficult for the asset price to move up. We call the price explosion to exceed the support or resistance zone as a price. After the price breakout, the old resistance zone turns into the new support zone. On the contrary, the old support zone turns into a new zone of resistance.
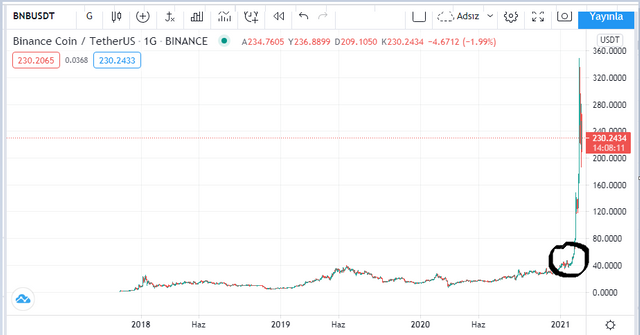
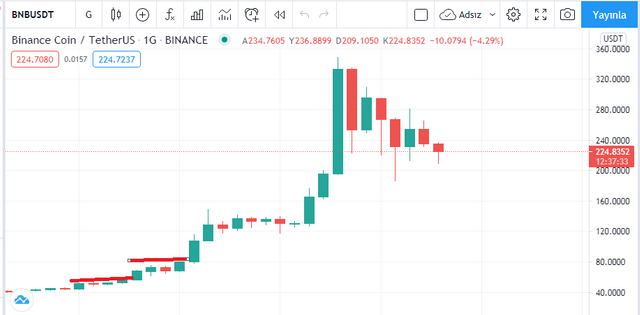
(BNB / USDT chart in tradingview.)
As you can see on the chart, BNB / USDT broke the resistance zone at $ 40 and caused a price break. After the price break, the BNB price goes up.
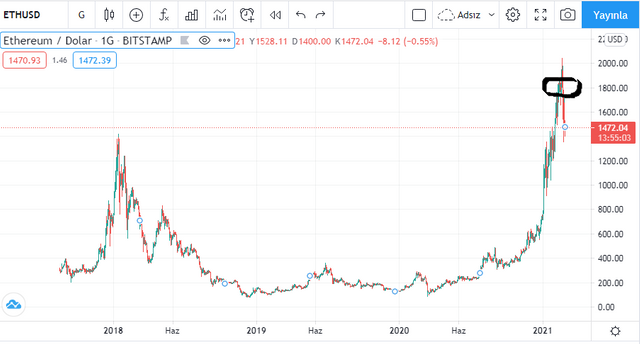
(ETH/USDT chart in tradingview)
As you can see on the chart, the ETH / USDT support zone at $ 1800 causes a price break. After the price break, ETH price goes down.
What Is A Continuation Pattern? Explain with Candlestick Charts and mention the price levels.
(tradingview BNB/USDT)
I show that the current trends of assets will continue in the continuation pattern. It is in the form of a downward or upward trend. When traders see the continuation pattern, they receive a signal that the trend will continue.
As you can see in the graph, there appears to be a continuation model. After $ 40, the price increased to $ 80.
What Is A Higher High Formation? (Explain with one of the crypto coin charts where the Higher High Formation identified.)
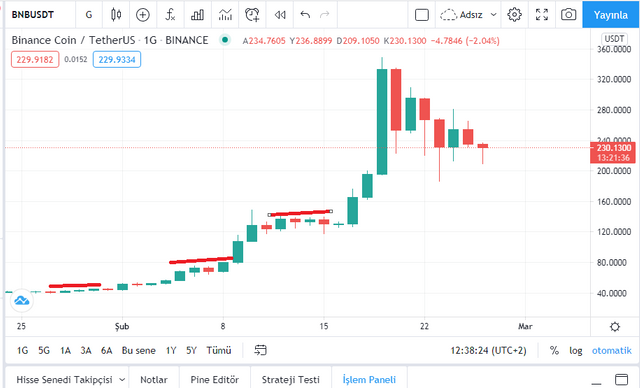
(tradinview BNB/USDT)
In the High High formation, the price reaches its highest level from the last time. Buyers are dominant over sellers.
BNB is starting to rise from $ 40. It reaches $ 120 after $ 80. Continuation pattern continues. Finally, it goes up to $ 320. An experienced trader saw the buy signal after $ 80.
What Is A Lower Low Formation? (Explain with one of the crypto coin charts where the Double Top Pattern identified.)
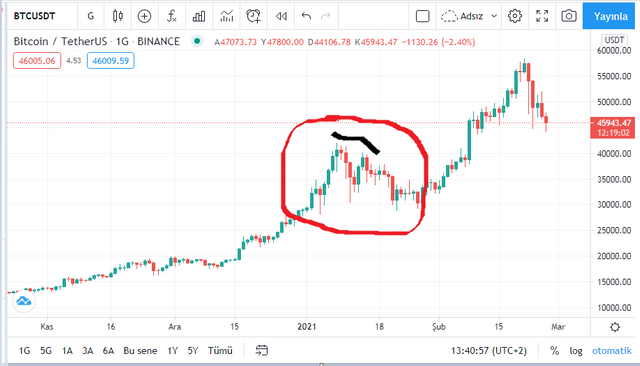
(tradingview BTC/USDT)
There is a bearish trend in the Lower Low formation. The asset's price moves towards a recent low. Meanwhile, traders who sell are much more dominant than traders who buy. As you can see on the chart, Bitcoin is dropping from the $ 40,000 level to $ 30,000.
What Is A Reversal Pattern?
It signals that the current trend is over, that the next trend will move in the opposite direction of the current trend. There are double top and double bottom formations. Buna iyi bir örnektir.
What Is A Double Top Pattern? Explain with one of the crypto coin charts where the Double Top Pattern identified.
The trend in the double top formation is bearish. The asset price has seen its highs twice and the asset price will now decline to the bottom. The uptrend is over and the downtrend will begin.
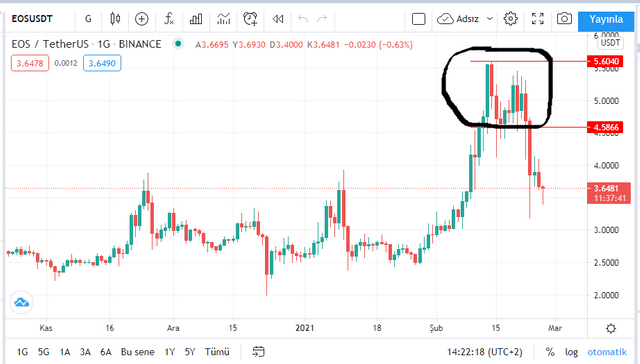
(tradinview EOS/USDT)
As you can see on the chart, EOS reached its highest price at $ 5.60. After the price dropped a little, it reached the level of $ 5.50 again. It has reached the highest price twice in the current trend and has a double top pattern. As you can see, after the formation of this graph, EOS price moved in the opposite direction of the current trend and the trend was in the direction of decline.
What Is A Double Bottom Pattern? (Explain with one of the crypto coin charts where the Double Bottom Pattern identified.)
In the Double Bottom formation, the asset price has dropped twice to its lowest level and the asset price will now rise upward. The downtrend has ended and the uptrend will begin.
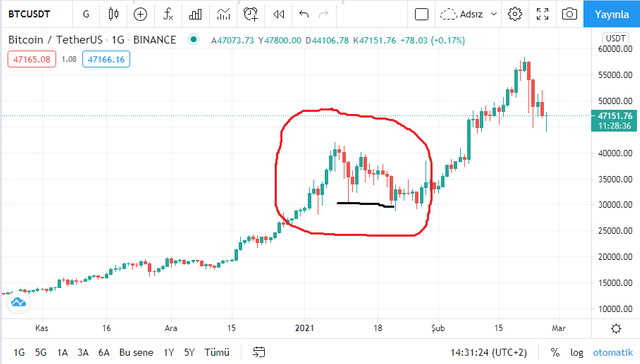
(tradingview BTC/USDT)
After the bitcoin price fell twice to $ 30,000, the double bottom pattern started to reach. Afterwards, as you can see in the picture, the current trend has started to move in reverse. The downward trend has been replaced by the upward trend.
In Investing & Trading What Is The Importance of Stop Level(STOPLOSS)?
In stock exchanges, we call Stop / Loss to order to sell when asset prices reach a certain price. The purpose of Stop Loss orders is to make a minimum loss.To minimize the damage. . Think about it, instead of doing 30% damage, you do 5% damage. This is great, I think.
Where To Find & How To Set A Stoploss?
Easy to find Stop / Loss. Past charts of the asset are examined. Support levels are checked. By finding the previous support, we can adjust the stop / loss level. After finding 3 support and 3 resistance points for the asset, we must place a buy order. Also, we must adjust our stop / loss level accordingly.
What Understood From This Course?/ Conclusion.
The courses are very beneficial. Thanks to the courses, I gain new terms, new perspectives. I have learned to read graphics now. I haven't learned how to draw shapes on Tradingview yet. However, when I look at an asset chart, I can immediately see the support and resistance point. I also learned the double bottom and double top patterns in this course. It gives us important signals to buy or sell. Other than that, I realized the importance of stop / loss. I will use the stop / loss after I find the support zones.
Hi @vivek086
Thank you for joining Steemit Crypto Academy and participated in the Homework Task 3.
Your Homework task 3 verification has been done by @Stream4u.
Thank You.
@stream4u
Crypto Professors : Steemit Crypto Academy