Crypto Academy Week 3 Homework Post for (stream4u) - What is Chart Patterns? , Price Breakout - Continuation Patterns , Reversal Patterns , STOPLOSS. EN-TR
(I created the image on snappa.com.)
Hello Steemit Crypto Academy Community,
I am about to complete my last course assignment this week. Course professor @stream4u. It is a very challenging and instructive course, so I reserved it for the last course.
Kursun konusu: ''| What is Chart Patterns? | Price Breakout - Continuation Patterns - Reversal Patterns | STOPLOSS.''
I want to complete my homework with the questions asked by the professor.
What Is A Chart Pattern? Explain with Candlestick Charts.
After people trade on the stock markets, a chart is created in which the price values of the assets are displayed. Here we call the resulting image the graphic model. Like the bitcoin chart model for example. Chart models can belong to very different time zones. We learned in our previous lesson.
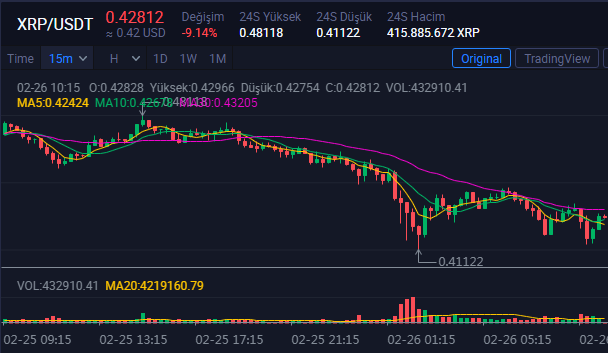
(15-minute chart pattern of XRP / USDT - Huobi.com)
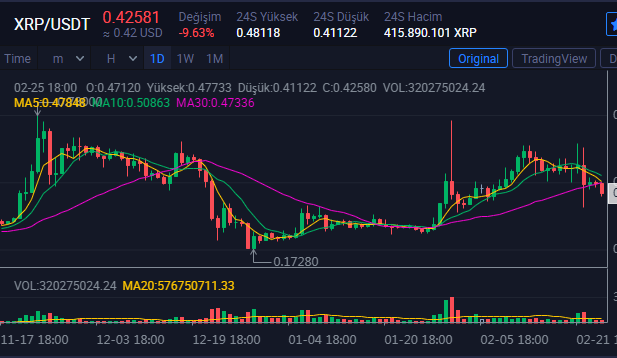
(1-day chart pattern of XRP / USDT - Huobi.com)
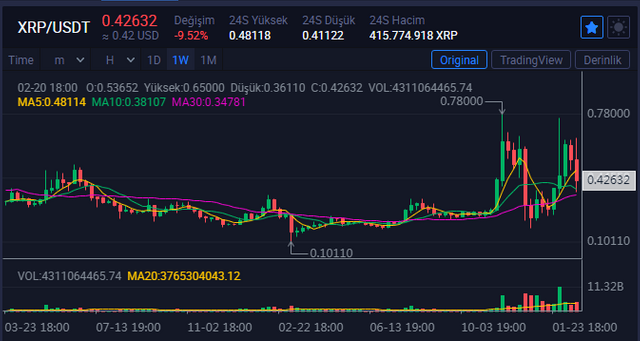
(1-week chart pattern of XRP / USDT)
Price movements create charts for various time frames. These can be 1 minute, 5 minutes, 15 minutes, 30 minutes, 1 hour, 4 hours, 1 day, 1 week, 1 month or more. Chart patterns traders send buy and sell signals. Traders also make their moves by studying different time zones.
The chart patterns feature red and green candlesticks, as well as the support and resistance zones. In the region where the support zone is, it is the region where it is difficult for the asset price to go further down. The resistance zone is also the zone where it is difficult for the asset price to move up further. There can be multiple support and resistance zones in a chart pattern.
What Is A Price Breakout? Explain with Candlestick Charts and mention the price levels.
We have mentioned that there are many support and resistance zones in the chart patterns. We called the area where it is difficult for the asset price to go down, the support zone. We also called the zone of resistance where it is difficult for the asset price to move up. We call the price explosion to exceed the support or resistance zone as a price. After the price breakout, the old resistance zone turns into the new support zone. On the contrary, the old support zone turns into a new zone of resistance.
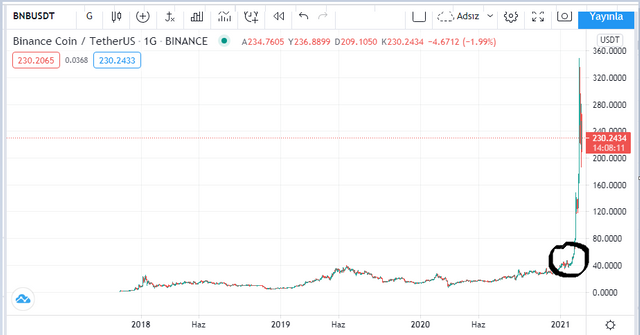
(BNB / USDT chart in tradingview.)
As you can see on the chart, BNB / USDT broke the resistance zone at $ 40 and caused a price break. After the price break, the BNB price goes up.
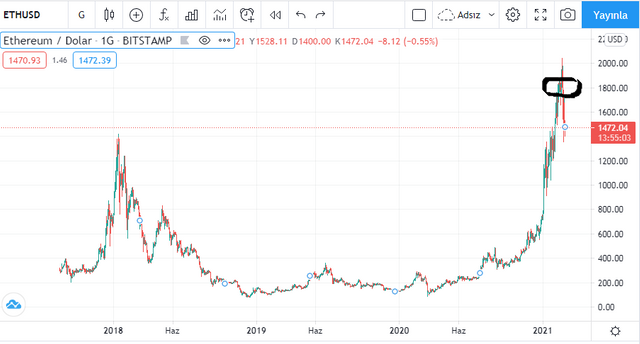
(ETH/USDT chart in tradingview)
As you can see on the chart, the ETH / USDT support zone at $ 1800 causes a price break. After the price break, ETH price goes down.
What Is A Continuation Pattern? Explain with Candlestick Charts and mention the price levels.
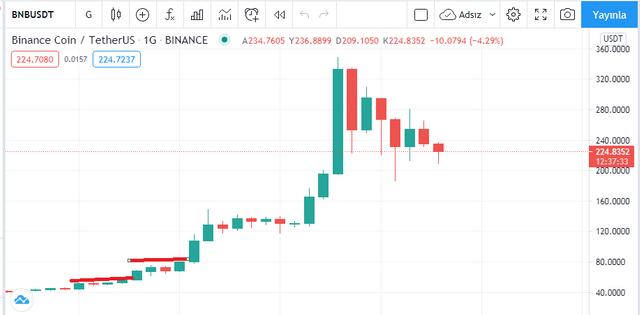
(tradingview BNB/USDT)
I show that the current trends of assets will continue in the continuation pattern. It is in the form of a downward or upward trend. When traders see the continuation pattern, they receive a signal that the trend will continue.
As you can see in the graph, there appears to be a continuation model. After $ 40, the price increased to $ 80.
What Is A Higher High Formation? (Explain with one of the crypto coin charts where the Higher High Formation identified.)
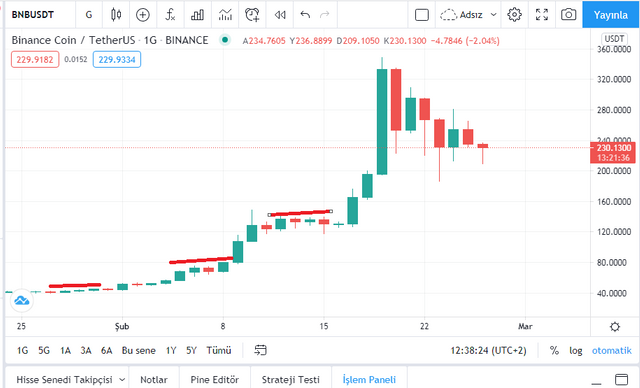
(tradinview BNB/USDT)
In the High High formation, the price reaches its highest level from the last time. Buyers are dominant over sellers.
BNB is starting to rise from $ 40. It reaches $ 120 after $ 80. Continuation pattern continues. Finally, it goes up to $ 320. An experienced trader saw the buy signal after $ 80.
What Is A Lower Low Formation? (Explain with one of the crypto coin charts where the Double Top Pattern identified.)
(tradingview BTC/USDT)
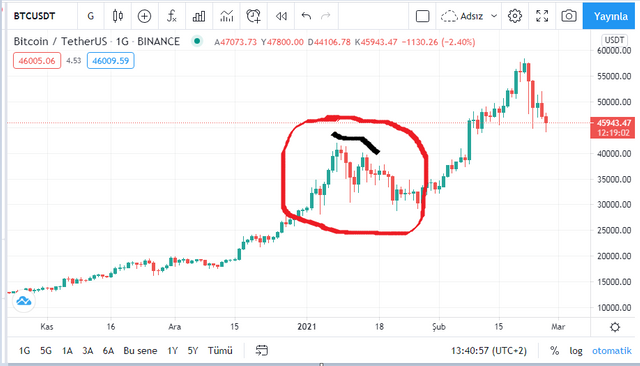
There is a bearish trend in the Lower Low formation. The asset's price moves towards a recent low. Meanwhile, traders who sell are much more dominant than traders who buy. As you can see on the chart, Bitcoin is dropping from the $ 40,000 level to $ 30,000.
What Is A Reversal Pattern?
It signals that the current trend is over, that the next trend will move in the opposite direction of the current trend. There are double top and double bottom formations. Buna iyi bir örnektir.
What Is A Double Top Pattern? Explain with one of the crypto coin charts where the Double Top Pattern identified.
The trend in the double top formation is bearish. The asset price has seen its highs twice and the asset price will now decline to the bottom. The uptrend is over and the downtrend will begin.
(tradinview EOS/USDT)
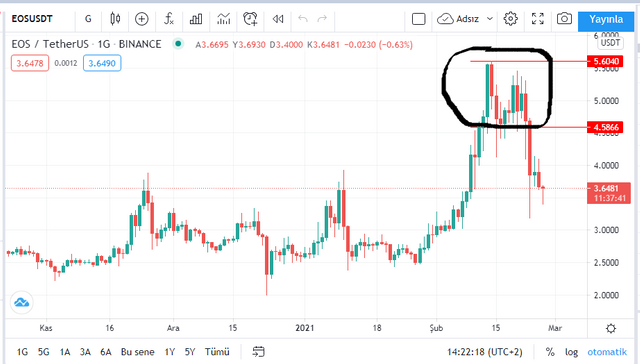
As you can see on the chart, EOS reached its highest price at $ 5.60. After the price dropped a little, it reached the level of $ 5.50 again. It has reached the highest price twice in the current trend and has a double top pattern. As you can see, after the formation of this graph, EOS price moved in the opposite direction of the current trend and the trend was in the direction of decline.
What Is A Double Bottom Pattern? (Explain with one of the crypto coin charts where the Double Bottom Pattern identified.)
In the Double Bottom formation, the asset price has dropped twice to its lowest level and the asset price will now rise upward. The downtrend has ended and the uptrend will begin.
(tradingview BTC/USDT)
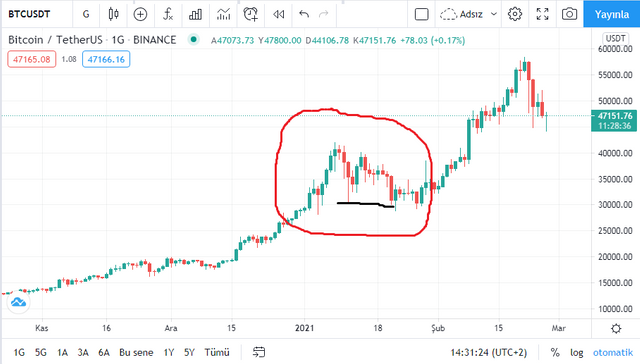
After the bitcoin price fell twice to $ 30,000, the double bottom pattern started to reach. Afterwards, as you can see in the picture, the current trend has started to move in reverse. The downward trend has been replaced by the upward trend.
In Investing & Trading What Is The Importance of Stop Level(STOPLOSS)?
In stock exchanges, we call Stop / Loss to order to sell when asset prices reach a certain price. The purpose of Stop Loss orders is to make a minimum loss.To minimize the damage. . Think about it, instead of doing 30% damage, you do 5% damage. This is great, I think.
Where To Find & How To Set A Stoploss?
Easy to find Stop / Loss. Past charts of the asset are examined. Support levels are checked. By finding the previous support, we can adjust the stop / loss level. After finding 3 support and 3 resistance points for the asset, we must place a buy order. Also, we must adjust our stop / loss level accordingly.
What Understood From This Course?/ Conclusion.
The courses are very beneficial. Thanks to the courses, I gain new terms, new perspectives. I have learned to read graphics now. I haven't learned how to draw shapes on Tradingview yet. However, when I look at an asset chart, I can immediately see the support and resistance point. I also learned the double bottom and double top patterns in this course. It gives us important signals to buy or sell. Other than that, I realized the importance of stop / loss. I will use the stop / loss after I find the support zones.
Türkçe
Merhaba Steemit Crypto Academy Topluluğu,
Bu haftaki son ders ödevimi tamamlamak üzereyim. Ders profesörü @stream4u. Çok zorlayıcı ve öğretici bir kurs, bu yüzden son kurs için ayırdım.
Kursun konusu: '' | Grafik Desenleri nedir? | Fiyat Patlaması - Devam Modelleri - Ters Çevirme Modelleri | KAYBI DURDURMAK.''
Profesörün sorduğu sorularla ödevimi tamamlamak istiyorum.
Grafik Modeli Nedir? Mum Grafikleri ile açıklayın.
Kişiler borsalarda işlem yaptıktan sonra, varlıkların fiyat değerlerinin görüntülendiği bir grafik oluşturulur. Burada ortaya çıkan görüntüye grafik model diyoruz. Örneğin bitcoin grafik modeli gibi. Grafik modelleri çok farklı saat dilimlerine ait olabilir. Önceki dersimizde öğrendik.
Fiyat hareketleri, çeşitli zaman dilimleri için grafikler oluşturur. Bunlar 1 dakika, 5 dakika, 15 dakika, 30 dakika, 1 saat, 4 saat, 1 gün, 1 hafta, 1 ay veya daha fazla olabilir. Grafik desenleri tüccarları alım satım sinyalleri gönderir. Tüccarlar ayrıca farklı zaman dilimlerini inceleyerek hamlelerini yaparlar.
Grafik formasyonlarında kırmızı ve yeşil mum çubuklarının yanı sıra destek ve direnç bölgeleri bulunur. Destek bölgesinin bulunduğu bölgede varlık fiyatının daha da düşmesinin zor olduğu bölgedir. Direnç bölgesi aynı zamanda varlık fiyatının daha fazla yükselmesinin zor olduğu bölgedir. Bir grafik deseninde birden fazla destek ve direnç bölgesi olabilir.
Fiyat Patlaması Nedir? Mum Grafikleri ile açıklayın ve fiyat seviyelerinden bahsedin.
Grafik desenlerinde birçok destek ve direnç bölgesi bulunduğundan bahsetmiştik. Varlık fiyatının düşmesinin zor olduğu bölgeye destek bölgesi dedik. Varlık fiyatının yükselmesinin zor olduğu direnç bölgesi olarak da adlandırdık. Destek veya direnç bölgesini aşmaya fiyat patlaması diyoruz. Fiyat kırılmasının ardından eski direnç bölgesi yeni destek bölgesine dönüşür. Aksine eski destek bölgesi yeni bir direnç bölgesine dönüşüyor.
Grafikte görebileceğiniz gibi, BNB / USDT direnç bölgesini 40 dolardan kırdı ve fiyat kırılmasına neden oldu. Fiyat kırılmasından sonra BNB fiyatı oldukça yükseldi.
Grafikte görebileceğiniz gibi, 1800 $ 'lık ETH / USDT destek bölgesi fiyat kırılmasına neden oluyor. Fiyat kırılmasından sonra ETH fiyatı düşmeye devam etti.
Devam Modeli Nedir? Mum Grafikleri ile açıklayın ve fiyat seviyelerinden bahsedin.
Varlıkların mevcut eğilimlerinin devam modelinde devam edeceğini görebiliriz. Aşağı veya yukarı doğru bir eğilim şeklindedir. Yatırımcılar devam modelini gördüklerinde, trendin devam edeceğine dair bir sinyal alırlar.
Grafikte görebileceğiniz gibi, bir devam modeli var gibi görünüyor. 40 dolardan sonra fiyat 80 dolara çıktı.
Daha Yüksek Bir Oluşum Nedir? (Yüksek Yüksek Formasyonun belirlendiği kripto para grafiklerinden biriyle açıklayın.)
Yüksek Yüksek oluşumda, fiyat son zamandan itibaren en yüksek seviyesine ulaşır. Alıcılar satıcılara göre daha baskındır.
BNB 40 dolardan yükselmeye başlıyor. 80 dolardan sonra 120 dolara ulaşıyor. Devam modeli devam ediyor. Son olarak 320 dolara kadar çıktı. Deneyimli bir tüccar 80 dolardan sonra satın alma sinyalini iyi görecektir.
Düşük Düşük Formasyon Nedir? (Double Top Modelinin belirlendiği kripto para grafiklerinden biriyle açıklayın.)
Daha Düşük formasyonunda düşüş eğilimi var. Varlığın fiyatı son zamanlarda en düşük seviyeye doğru hareket ediyor. Bu arada, satış yapan tüccarlar, satın alan tüccarlardan çok daha baskındır. Grafikte görebileceğiniz gibi, Bitcoin 40.000 $ seviyesinden 30.000 $ 'a düşüyor.
Ters Çevirme Örüntüsü Nedir?
Mevcut trendin sona erdiğini, bir sonraki trendin mevcut trendin tersi yönde hareket edeceğini işaret ediyor. Çift üst ve çift dip oluşumları vardır. Buna iyi bir örnektir.
Çift Üst Desen Nedir? Double Top Modelinin belirlendiği kripto para grafiklerinden biriyle açıklayın.
Çift tepe oluşumundaki eğilim düşüş eğilimindedir. Varlık fiyatı iki kez yüksek seviyesini gördü ve varlık fiyatı şimdi dibe düşecek. Yükseliş trendi bitti ve düşüş trendi başlayacak.
Grafikte görebileceğiniz gibi, EOS 5,60 $ ile en yüksek fiyatına ulaştı. Fiyat biraz düştükten sonra tekrar 5,50 dolar seviyesine ulaştı. Mevcut trendde iki kez en yüksek fiyata ulaştı ve çift tepe modeline sahip. Gördüğünüz gibi, bu grafiğin oluşumundan sonra EOS fiyatı mevcut trendin tersi yönde hareket etti ve trend düşüş yönündeydi.
Çift Tabanlı Desen Nedir? (Double Bottom Pattern'in belirlendiği kripto para grafiklerinden biriyle açıklayın.)
Çift Dip oluşumunda, varlık fiyatı iki kez en düşük seviyesine düştü ve varlık fiyatı şimdi yükselecek. Düşüş trendi sona erdi ve yükseliş trendi başlayacak.
Bitcoin fiyatı iki kez 30.000 $ 'a düştükten sonra, çift dipli desen ulaşmaya başladı. Daha sonra resimde de gördüğünüz gibi mevcut trend tersine hareket etmeye başladı. Düşüş eğilimi yerini yükseliş eğilimi aldı.
Yatırım ve Ticarette Stop Seviyesinin (STOPLOSS) Önemi Nedir?
Borsalarda varlık fiyatları belli bir fiyata ulaştığında satış emri vermek için Stop / Loss diyoruz. Zararı Durdur emirlerinin amacı minimum zarar vermek, hasarı en aza indirmektir. . Bir düşünün, % 30 zarar edeceğinize % 5 zarar ediyorsunuz. Bu harika bence.
Stoploss Nerede Bulunur ve Nasıl Ayarlanır?
Stop / Loss'u bulmak kolay. Varlığın geçmiş grafikleri incelenir. Destek seviyeleri kontrol edilir. Önceki desteği bularak durdurma / kaybetme seviyesini ayarlayabiliriz. Varlık için 3 destek ve 3 direnç puanı bulduktan sonra, bir satın alma emri vermeliyiz. Ayrıca, durdurma / kaybetme seviyemizi de buna göre ayarlamalıyız.
Bu Kurstan Ne Anlaşıldı? / Sonuç.
Kurslar çok faydalı. Kurslar sayesinde yeni terimler, yeni bakış açıları kazanıyorum. Artık grafikleri okumayı öğrendim. Tradingview'da şekillerin nasıl çizileceğini henüz öğrenmedim. Ancak bir varlık grafiğine baktığımda hemen destek ve direnç noktasını görebiliyorum. Bu derste ayrıca çift dip ve çift üst kalıplarını da öğrendim. Bize satın almak veya satmak için önemli sinyaller veriyor. Bunun dışında stop / loss'un önemini anladım. Destek bölgelerini bulduktan sonra stop / loss kullanacağım.
Hi @tht,
Thank you for joining Steemit Crypto Academy and participated in the Homework Task 3.
Your Homework task 3 verification has been done by @Stream4u.
Thank You.
@stream4u
Crypto Professors : Steemit Crypto Academy
Thank you, professor. Thanks to you, I am learning a lot. I have a hard time drawing graphics in Tradinview. Is drawing graphics as one of the topics of our course?
Not sure what you refer to drawing graphics, but if it is about tools Drawing on Tradinview, like below then it is a very waste. Not sure if all are here using Tradingview. Actually, we don't need to go for all these drawings.
Having more than 3 years' experience in Live trading, only one line says many things about accurate buying levels.
Hence drawing a line a very important and this is what I am trying to covering in every course. In the next course, everyone may require TradingView because I will be going to discuss one of the most important and easy indicators.
Twitter sharing
https://twitter.com/Steemtht/status/1365292117313130505