Homework-Task 4by @stream4u | given by @suboohi
INTRODUCTION :
Hi steemains, hope you all are good and enjoying your lives. I took lecture of professor @stream4u , he gives a detailed lecture and I get good knowledge about "How Support Can Become Resistance & Resistance Become Support", "Technical Indicator", how and what kind of help we can get from the technical indicators, some basic about "TradingView" and how it will help us in Trading and Investment, and one of a powerful Indicator "200 Moving Average".
HOME WORK TASK 4:
(Topic 1): What Is The Meaning Of Support Can Become Resistance & Resistance Become Support, When and Where set Buy trade, Chart Example?
(Topic 2): What Is A Technical Indicator? (You can explore it as much as you can, like explain its role, show anyone technical indicator from your chart and name of that Indicator.?)
(Topic 3): Provide your view and explore TradingView.
(Topic 4): What is 200 Moving Average, how and when we can trade/invest with the help of 200 Moving Average? Show different price reactions towards 200 Moving Average.
ANSWER TO THE HOME WORK TASK 4:
Task Topic 1
: What Is The Meaning Of Support Can Become Resistance & Resistance Become Support, When and Where set Buy trade, Chart Example?
support and Resistance :
"Support" is the level of stock market at which demand is strong enough to stop the stock prices to falls down more. It gives a good buyer position to the traders.
"Resistance" is the level of stock market at which supply is strong enough to stop the stock prices from moving higher and it gives a good sell position to a trader.

These two levels are crucial points in time frame where the
the two forces of supply and demand meet. The technical analysts evaluate the support and resistance level by determining market psychology and supply and demand.
HOW SUPPORT BECOMES RESISTANCE AND RESISTANCE BECOMES SUPPORT:
For a technical analysis the main concept is that when a resistance or support level is broken,either prices trend moves up or falls down, its role is to reversed back. If the price falls down to a support level, that level will become resistance. If the price rises up to a resistance level, it will become support. Or we can say that it is thought that supply and demand has shifted to reverse its role.
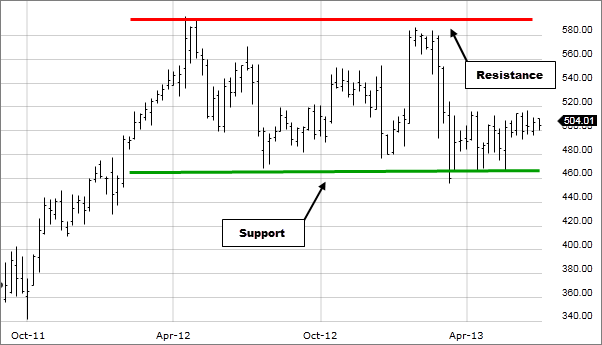
On the chart pattern when the price of an asset falls down below a last drawn support line and rises up again to the first drawn Support line and falls down again thereby becoming a Resistance.

The above picture is an example of Support becomes Resistance.
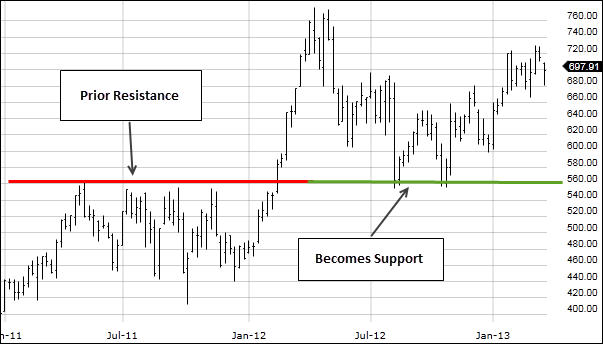
When the price of an asset of coins falls down from the last drawn resistance line , the price falls down and the price of the assets of coins rises up again faraway the point of the last resistance line and becoming a Support. It is preferable to place buy order when the resistance becomes support.
Example of Resistance becomes Support
Task Topic 2:
: What Is A Technical Indicator? (You can explore it as much as you can, like explain its role, show anyone technical indicator from your chart and name of that Indicator.?)
Technical Indicators:
By evaluating the privous data, technical analysts use indicators to predict future price movements trends in stock market.
Or we can say that it is a mathematical calculation that based on historic price, volume, open interest or loss information that perpose to predict the financial market direction.
TYPES OF TECHNICAL INDICATORS:
There are four main types of technical indicators:
1.Trend Following
2.Oscillators
3.Volatility
4.Support/Resistance
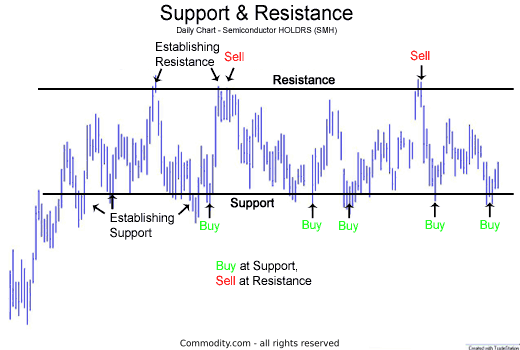
They are categories on their function. Technical indicators are used in technical evaluation on an asset chart pattern to predict the price movement of a specific asset at a particular time. Only getting the knowledge of buying and selling cannot be enough to trade and invest profitably in stock market, so there is always a need for technical indicators to give the basic vision to the price behaviour of different assets. There are many of them but I will be showing the commodity.com for resistance and support indicator as example.
Task Topic 3:
: Provide your view and explore Trading View.
Trading View:
In simple words we can explain it as"Trading View" is a social large network for traders and investors on Stock, Futures and Foreign exchange currencies.
It is used for assets charting that make a base for traders and technical analysts to evaluate real time price behavior of assets.
It's not limited to cryptocurrency alone, it's services are expended to crypto, for ex, stocks and other financial stocks markets.
Trading view comprises many technical tools such as the technical indicators that shows to make a good decision for buy or sell.
Trading View lets you explore the investment ideas and showcase your talents to a large and active community of traders. Freely discuss, share, and learn with thousands of market participants using TradingView.
You can get better trading and investing by seeing what others are doing at stock market._
Nowadays, Tradingview is broadly endorse by many technical analysts for its large availability of great tools and indicators to analyse the financial market very precisely.
Their is an app for mobile.
TradingView App:
This App can be downloaded on the App Store or Google play store.
After download, open it and you will have the screen shown in picture given below.

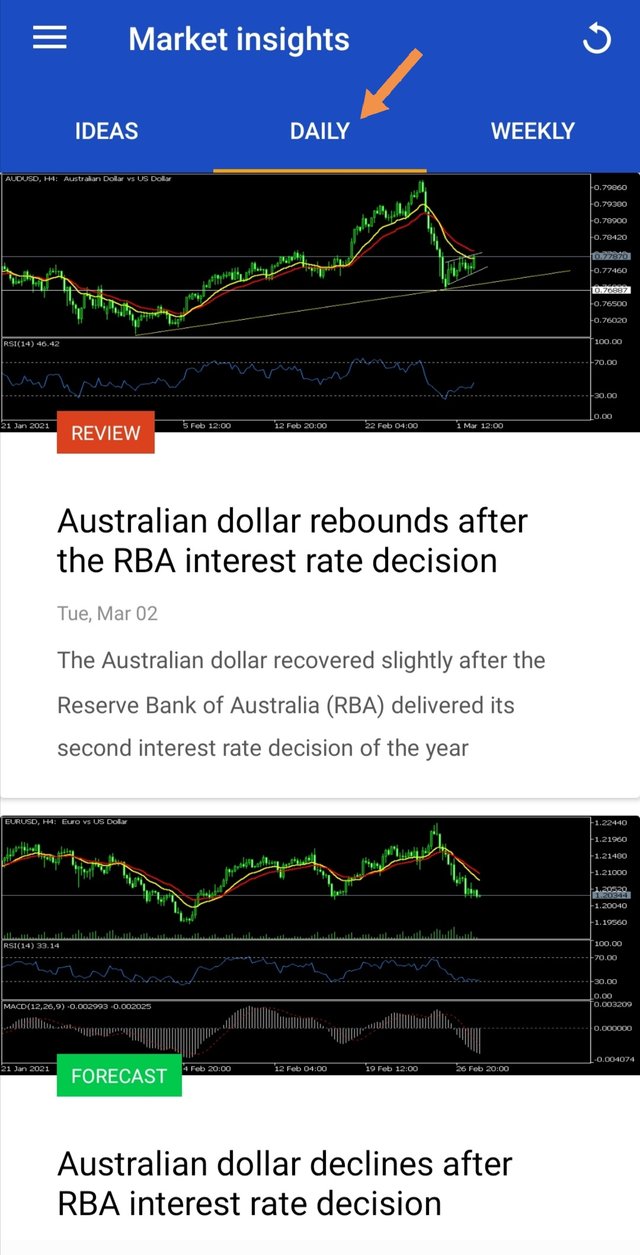
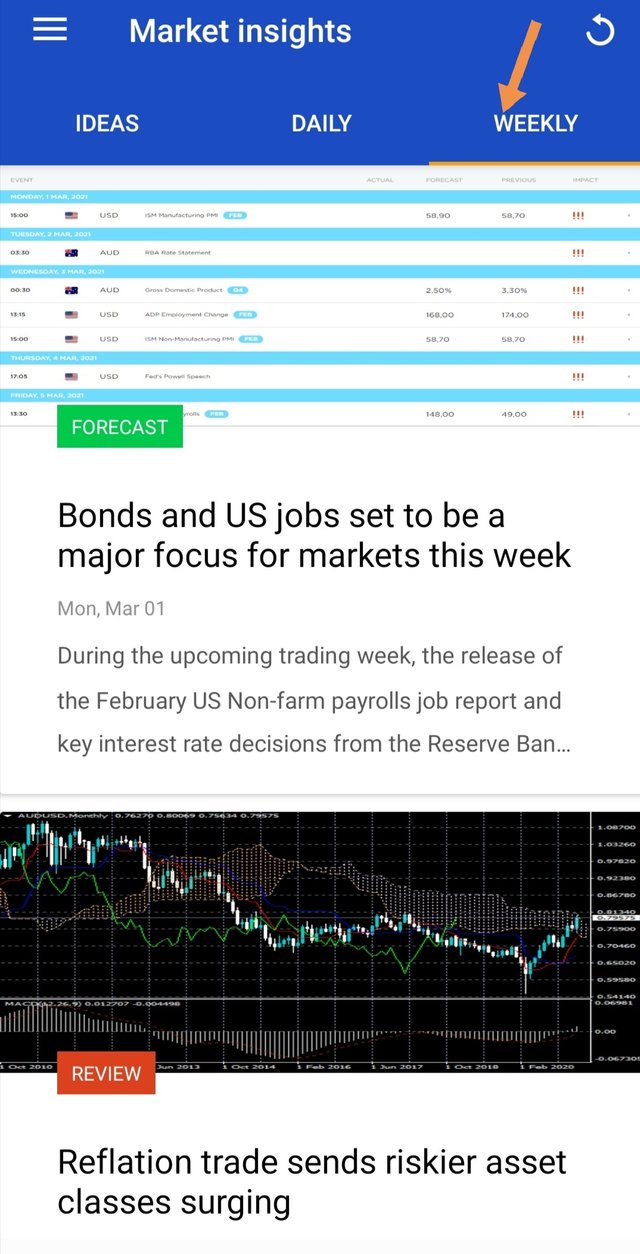
___From menu page you can see the app have different trading tools, for both either buying or selling. You can see the market price for different currencies. When you select the market insight they give you three options. 1.give an idea about currency trading, 2.show market prices on daily bases and 3.show market prices on weekly basis, this will help you to evaluate the market trend or help to trade either buying or selling your assets. ___
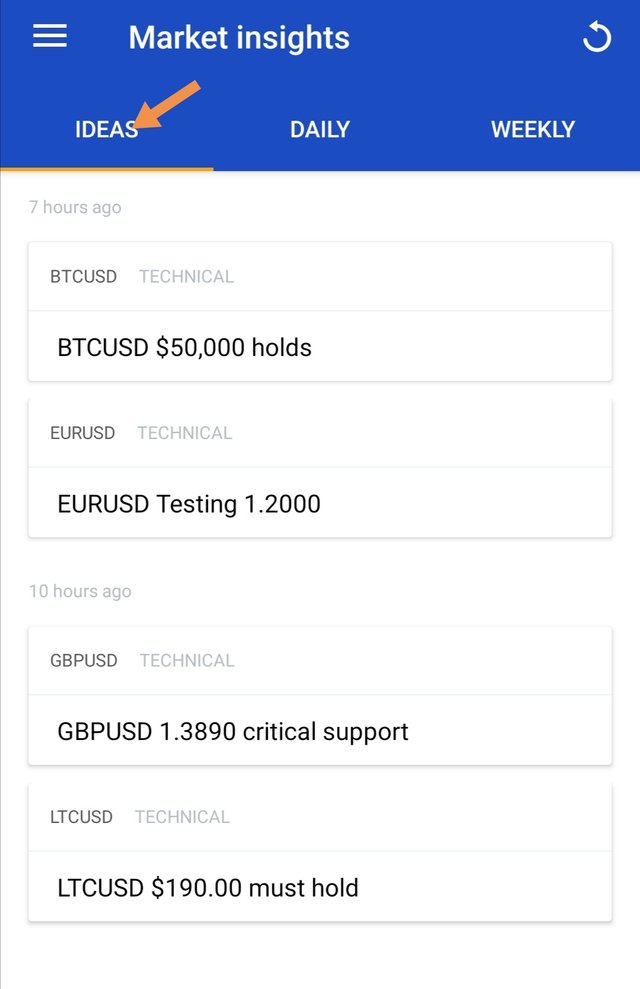
TradingView App landing page.
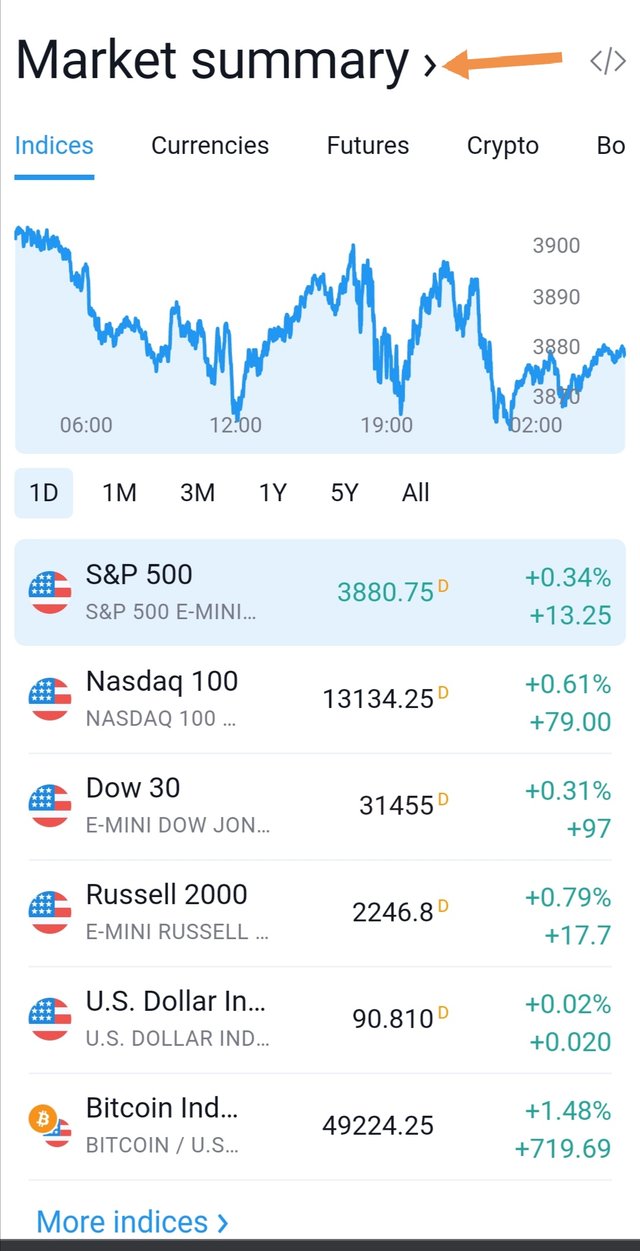
TradingView Chart page
The trading view indicators.
There are many options at the top of the page and can be chosen for the asset, you are looking for at the top where a pair of BTCUSDT was written. Also, you can select different technical indicators to be used for your analysis.
Task Topic 4:
: What is 200 Moving Average, how and when we can trade/invest with the help of 200 Moving Average? Show different price reactions towards 200 Moving Average.
200 _day Moving Average:
The moving average give traders an idea about trend, whether the trend is moving up or down in stock market . It also helps to locate the potential support or resistance areas at particular time frame.
For a long term estimation or forecasts of assets to make a massive profit from the trade or investment in the nearest future, a very strong indicator "the 200 moving average" is used. It help traders to evaluate the trend of an asset either in downtrend or uptrend and also allows them the see the supports and resistance on the chart pattern.

___The chart pattern showing bitcoin 200 moving average of price multiple _steemit ___
: How to Invest or Trade with the 200 moving average?
The 200-day SMA, which covers roughly 40 weeks of trading. It is frequently used in stock trading to find the general market trend. As long as a stock price remains above the 200-day SMA on the daily time frame, the stock is generally considered to be in an overall uptrend and vise versa
If the price of an asset is below the 200 moving average, that's a good sell indication. Then in investing or trading, you consider selling such asset.
_
If the price is of an asset above the 200 moving average, it's a good indicator to buying the asset. And the trader should make a decision to buy which is the best position of trade at the moment.
Thanks for reviewing this and my regards to the crypto professor @stream4u for his great teaching.
Thank you all.
###Special regards;
###Cc: @steemcurator01
###Cc: @steemcurator02
###Cc: @steemitblog
###Cc: @stream4u-week4
Written by; @suboohi

Hi @suboohi
Thank you for joining Steemit Crypto Academy and participated in the Homework Task 4.
Your Homework task 4 verification has been done by @Stream4u, if you made correction and make it in a own words, just ping me here and I will come back to review it.
Thank You.
@stream4u
Crypto Professors : Steemit Crypto Academy
https://steemit.com/hive-108451/@suboohi/steemit-crypto-academy-or-course-4-by-stream4u-or
Hi @suboohi
Thank you for joining Steemit Crypto Academy and participated in the Homework Task 4.
Requesting you to please maintain the Steemit Post/Blog Guidelines.
Please attach the sources to the above contents OR phrase/explain it in your own way.
Your Homework task 4 verification has been done by @Stream4u, if you made a correction just ping me here and I will come back again to review it.
Thank You.
@stream4u
Crypto Professors : Steemit Crypto Academy
https://steemit.com/hive-108451/@suboohi/steemit-crypto-academy-or-course-4-by-stream4u-or
Hi @suboohi
Thank you for joining Steemit Crypto Academy and participated in the Homework Task 4.
Your Homework task 4 verification has been done by @Stream4u.
Thank You.
@stream4u
Crypto Professors : Steemit Crypto Academy